Enterprise Data Governance Platform

Dataloka Intelligence — Enterprise Data Governance Platform

Dataloka Intelligence is the unified knowledge-graph platform that empowers your organization to discover, govern, and deliver trusted data.
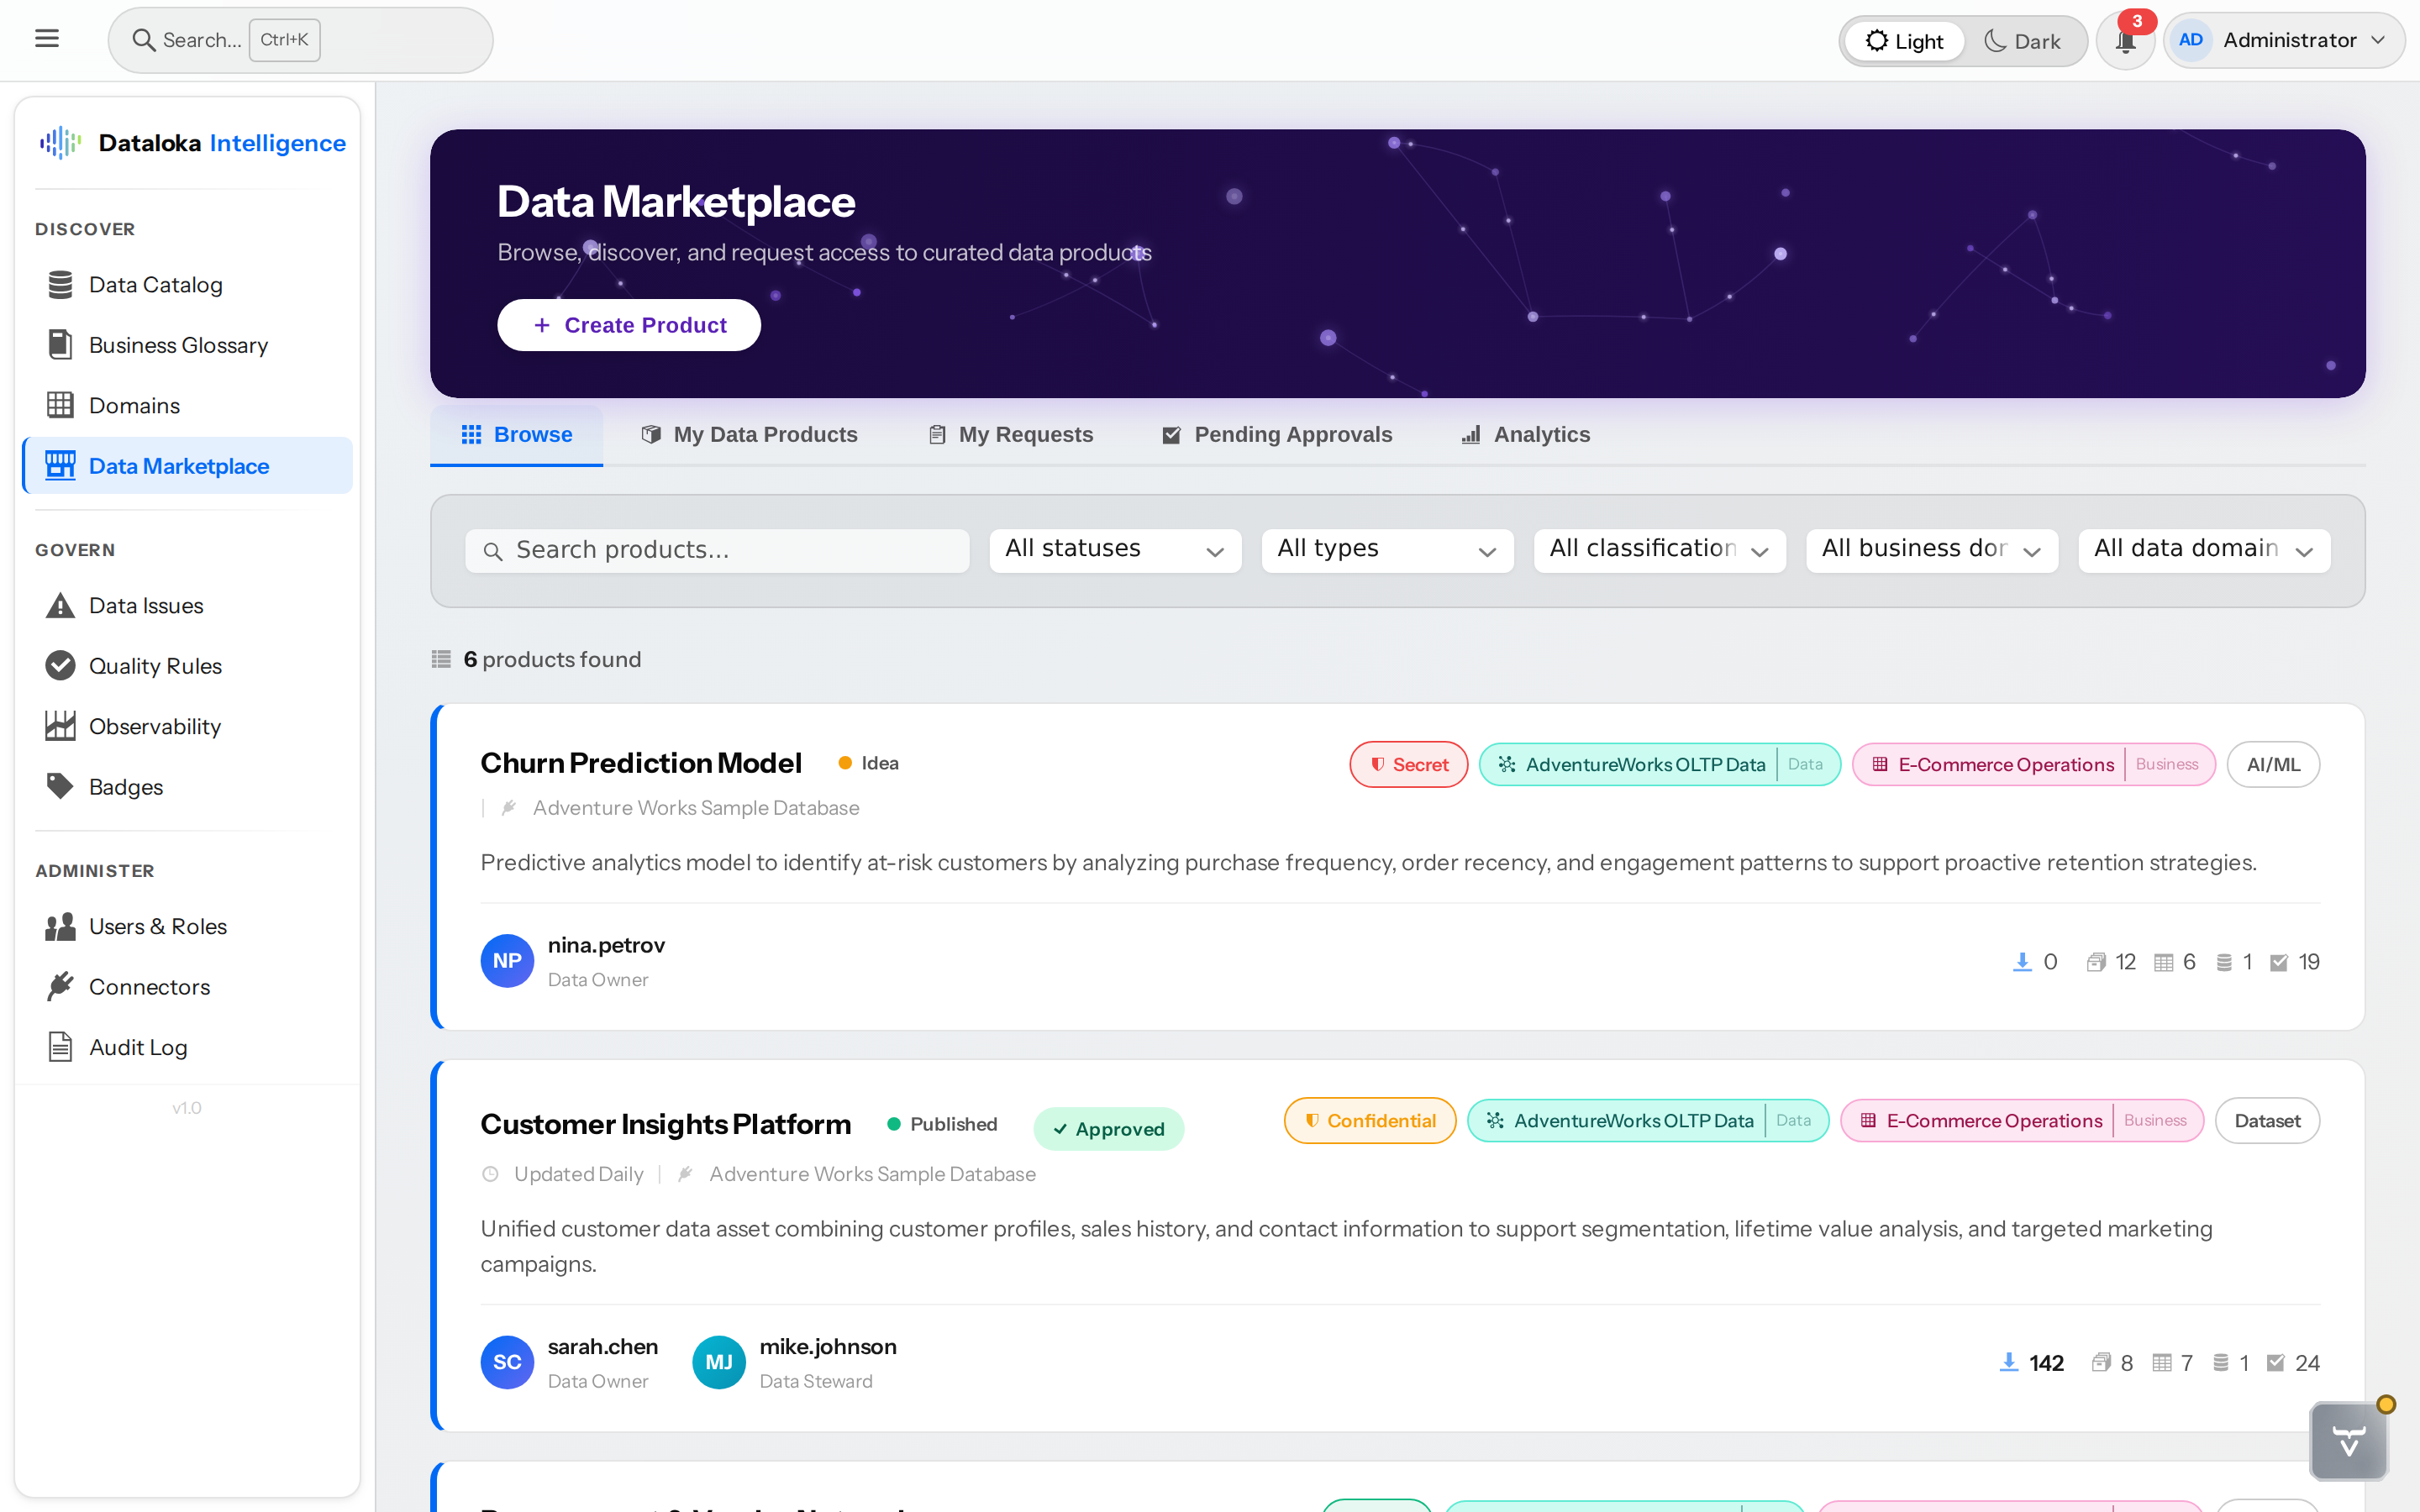
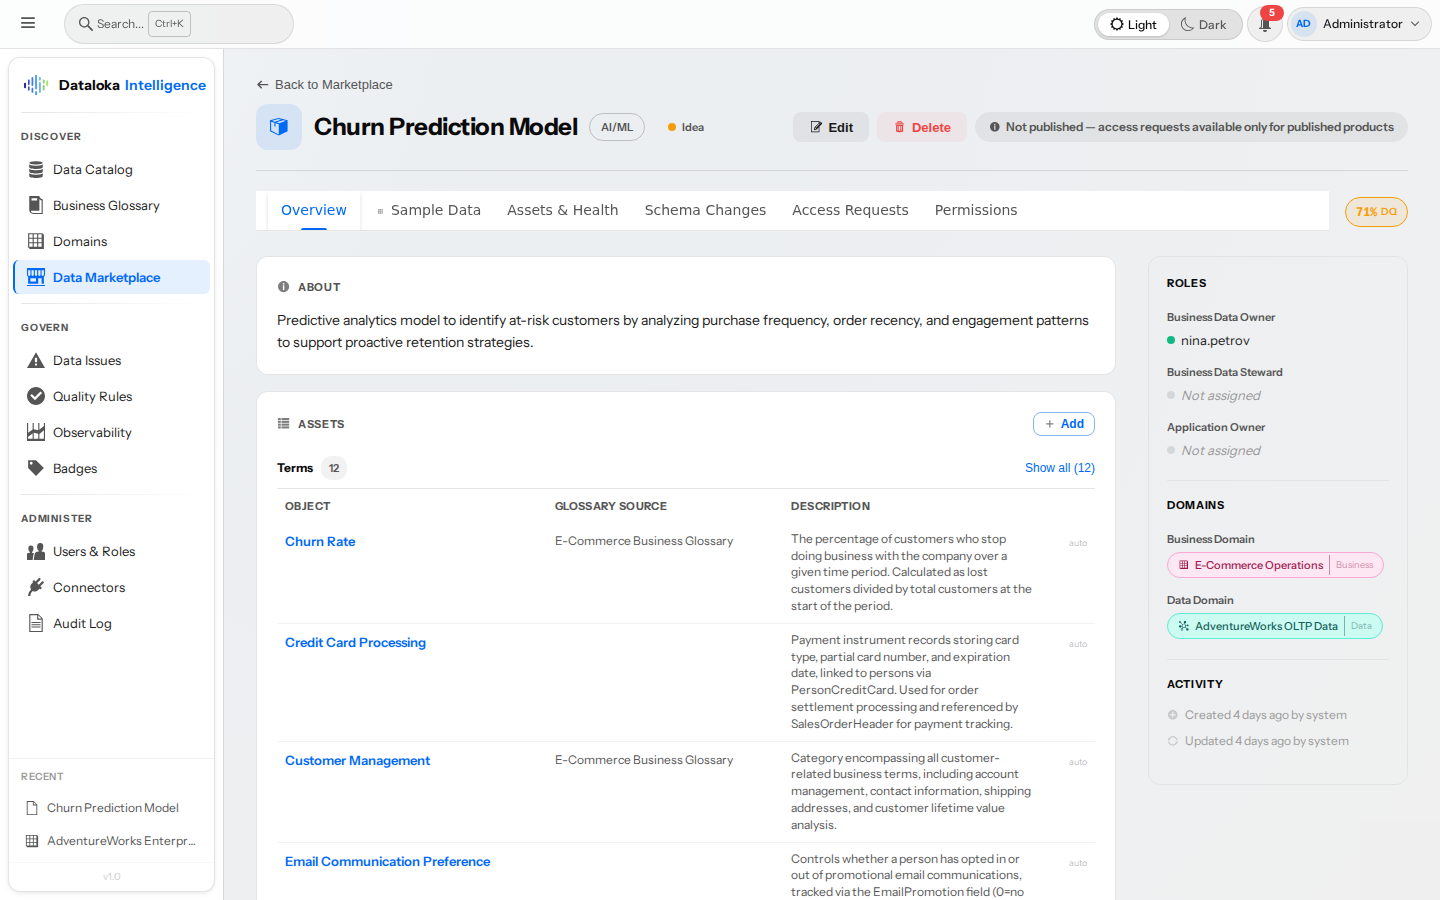
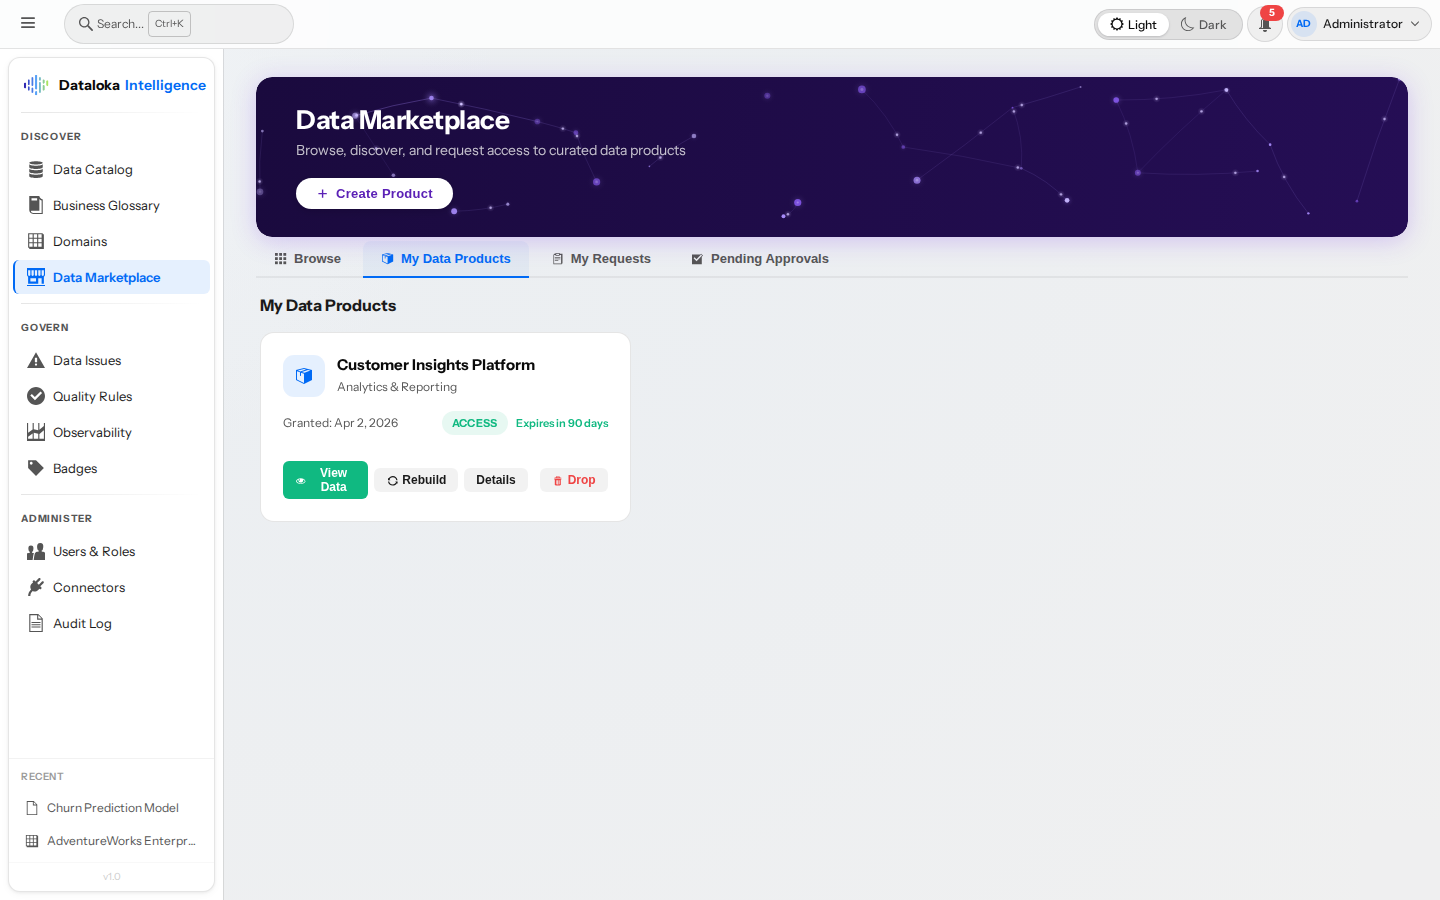
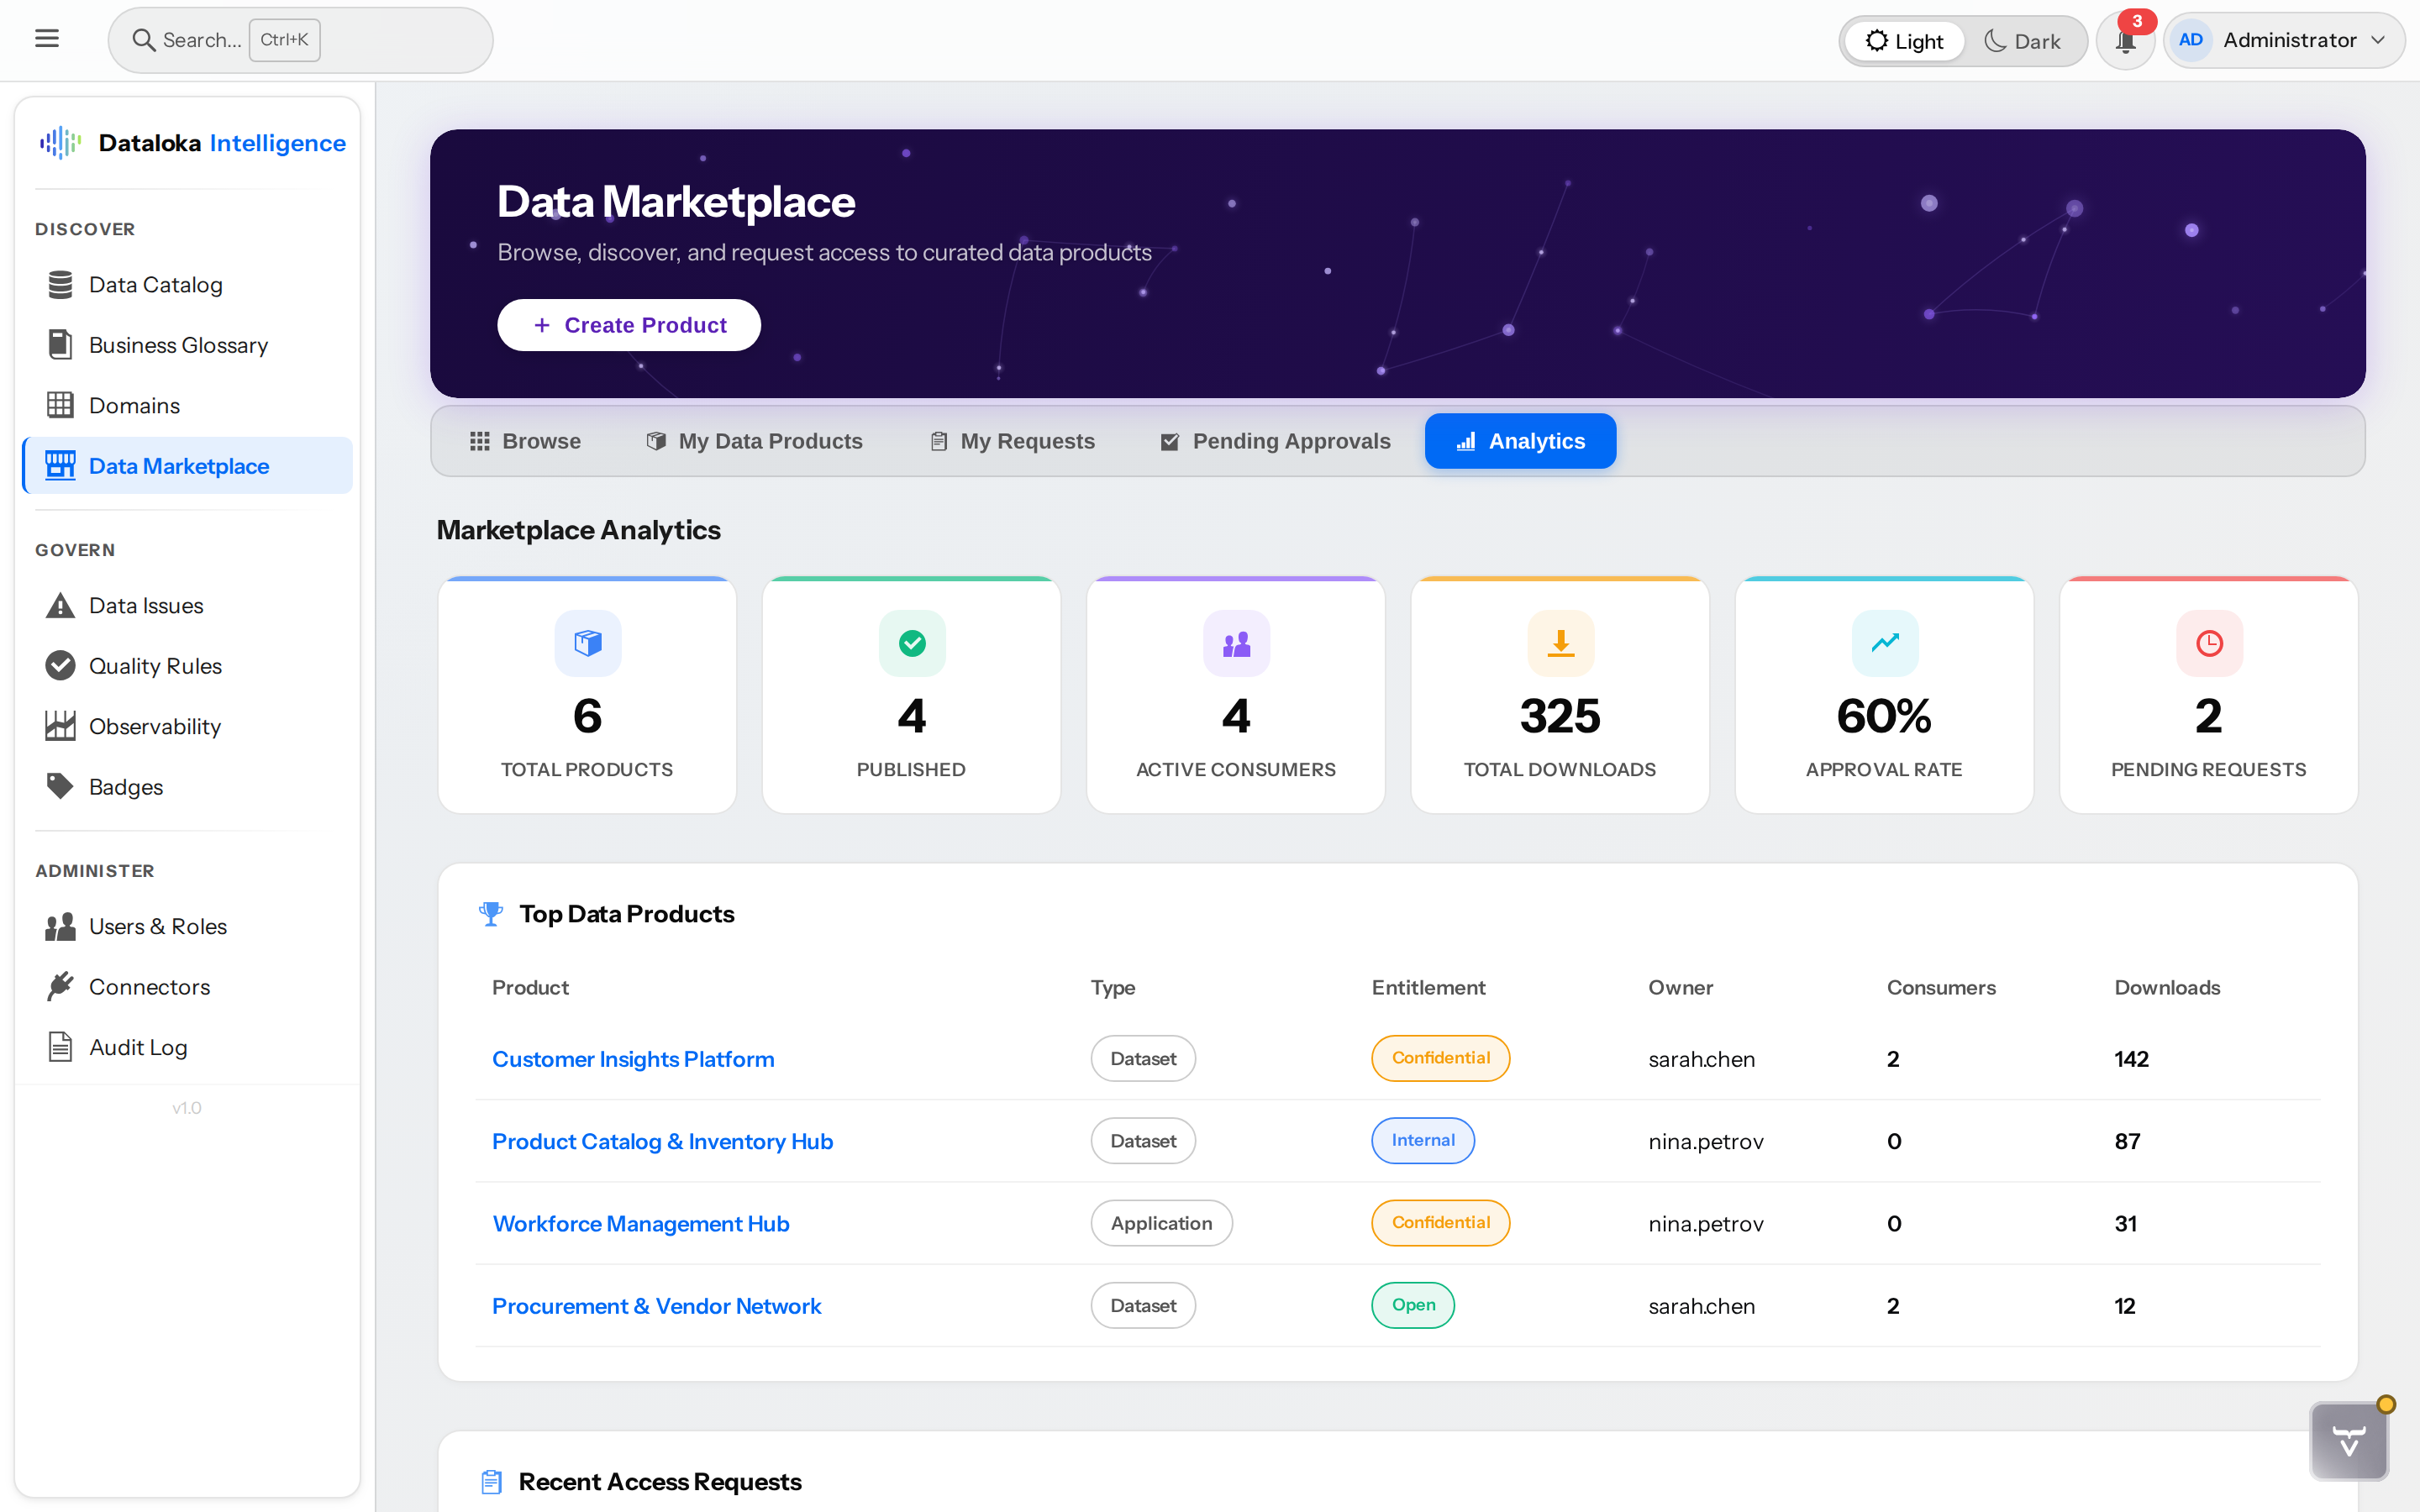
Data CatalogData QualityData Marketplace
0+
Connectors
0+
DQ & Observability Rules
0
Stewardship Roles
Dataloka Intelligence — Login
Featured Module

Data Marketplace

Give every team a self-service storefront for governed data products. Browse, request access, and connect to trusted datasets in minutes — no tickets, no waiting, no shadow copies. Four classification levels (Open, Internal, Confidential, Secret) with automatic or multi-role approval ensure the right data reaches the right people.

Data Marketplace — browse, discover, and request access to curated data products
🛒
Shopping-Style Storefront
Business users discover data products with an intuitive catalog showing classification, domain badges, ownership, quality scores, and lifecycle status at a glance.
🔒
Smart Access Workflow
Open & Internal data auto-approves instantly. Confidential requires single approval. Secret enforces dual approval from two different reviewers — compliance built in, not bolted on.
Built-in Data Lakehouse
One-click “Build Data” materializes approved datasets into Apache Iceberg format. Query instantly via Trino SQL from any BI tool — no separate warehouse needed.
📊
BI Tool Integration
Data Analysts connect Tableau, Power BI, DBeaver, or Python to approved data in seconds with pre-configured build-in Datalakehouse JDBC connection strings and step-by-step guides.
📦
Multi-Format Export
Download approved datasets in CSV, Excel, JSON, or Parquet. Date-range filtering and presigned URLs for seamless integration with downstream workflows.
🔔
Access Lifecycle & Governance
Configurable expire durations, automated expiry with 14-day renewal warnings, owner-initiated revocation, and bulk revocation on product deprecation — full audit trail included.
🛡️
Dynamic PII Masking
Sensitive columns are automatically masked in sample previews and data exports. Only authorized data stewards and data owners can unmask — keeping your organization compliant with Indonesia PDP Law or PII/GDPR requirements.
Data Product Detail
Data Product Detail
Complete product profile with lifecycle tracking (Idea → Published), governance roles, and dedicated tabs for data preview, asset health, schema changes, and access management.
Live Sample Data
Sample Data Preview
“Try before you buy” — explore sample rows with business term badges on column headers. No approval needed to preview data before requesting access. Dynamic data masking for protecting sensitive data.
Assets & Health
Assets and Quality Health
Transparent data quality — see DQ scores, rule pass rates, and observability health for every table so consumers know exactly what they are getting.
My Data Products
My Data Products
Manage approved products with expiration countdowns and one-click Build, View, Rebuild, Renew, and Drop actions for private data lakehouse-materialized datasets.
Access Requests & Approvals
Access Request and Approval Management
Full transparency for every request — requester, justification, approval status, and revoke actions. Stewards approve, reject with reason, or route to a second approver for Secret-classified data.
Marketplace Analytics
Marketplace Analytics Dashboard
Platform KPIs at a glance — total products, active consumers, downloads, approval rates, and pending requests. Identify top data products and monitor governance workload.
🗃️
Source Database
⚙️
Build Data
📦
Optimized Storage
❄️
Data Lakehouse Format
SQL Query Engine
📈
Tableau / Power BI DBeaver / Python
Data Catalog

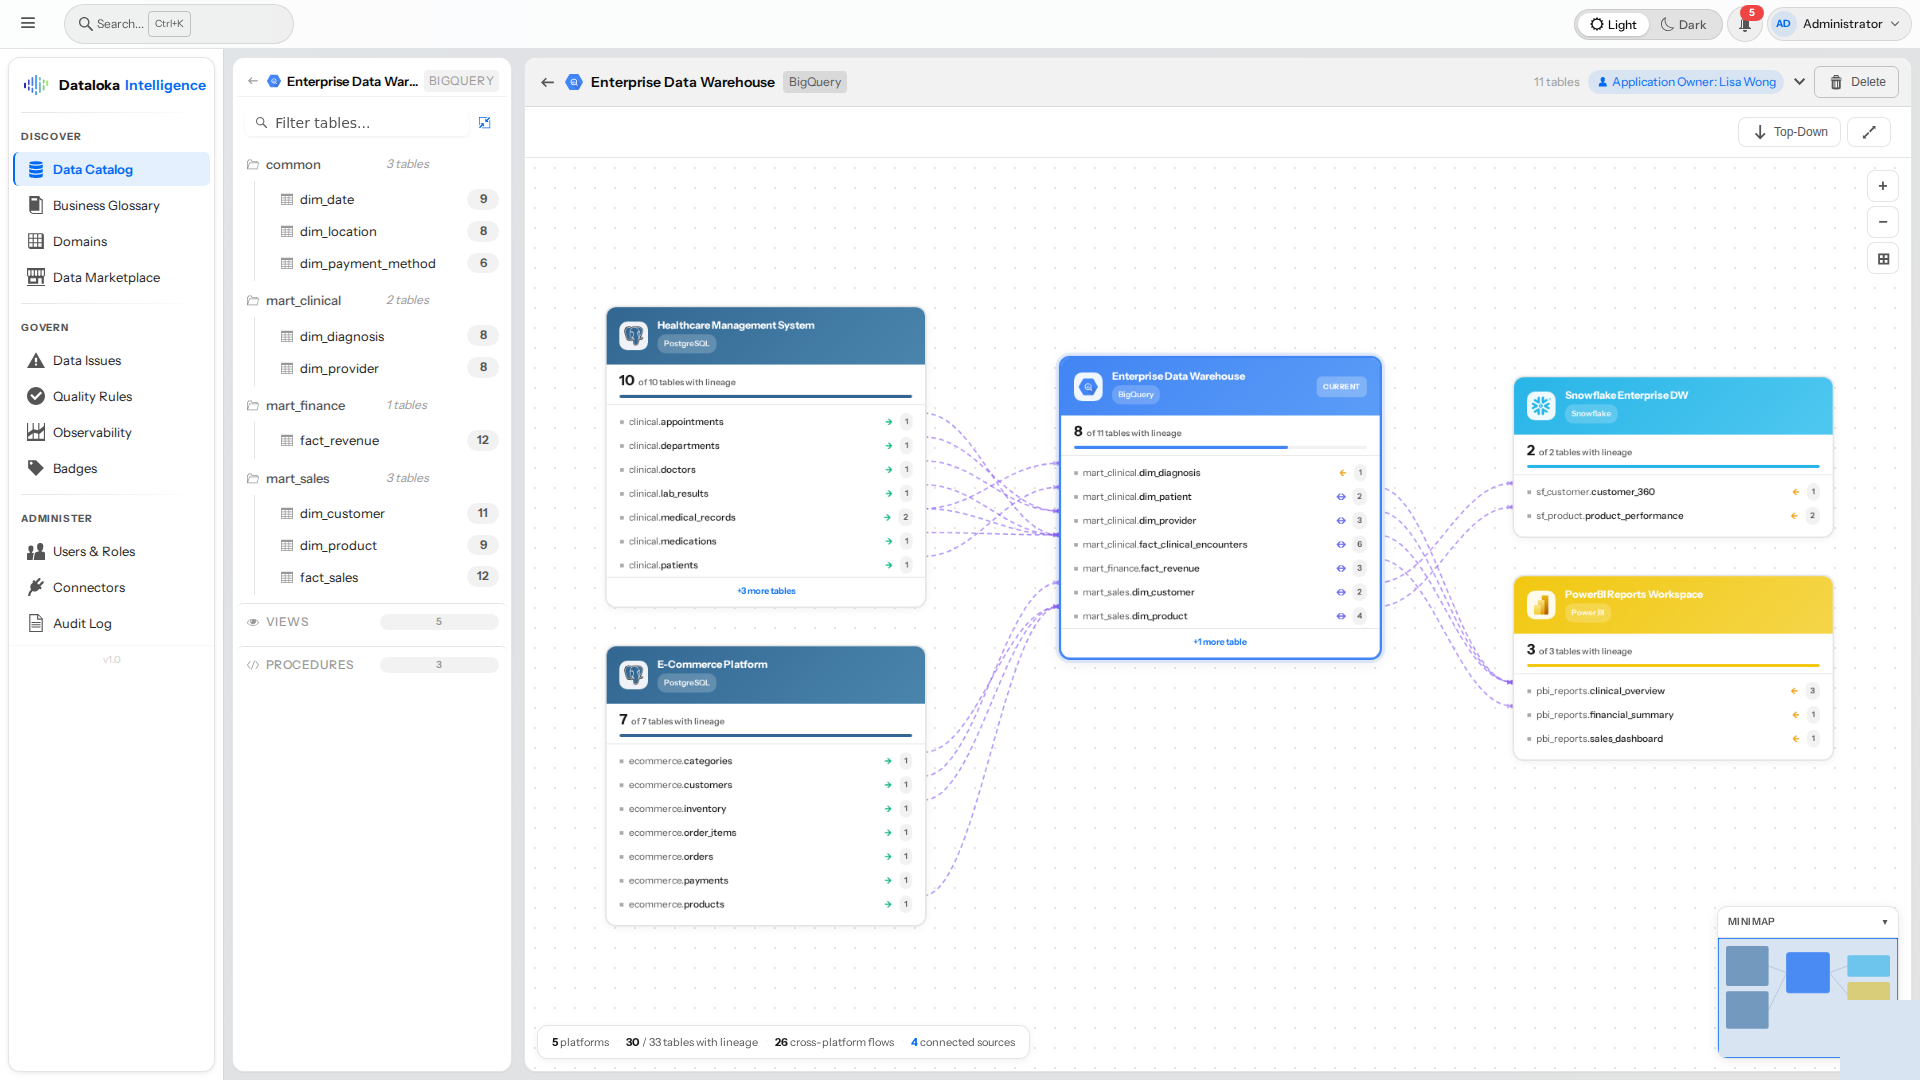
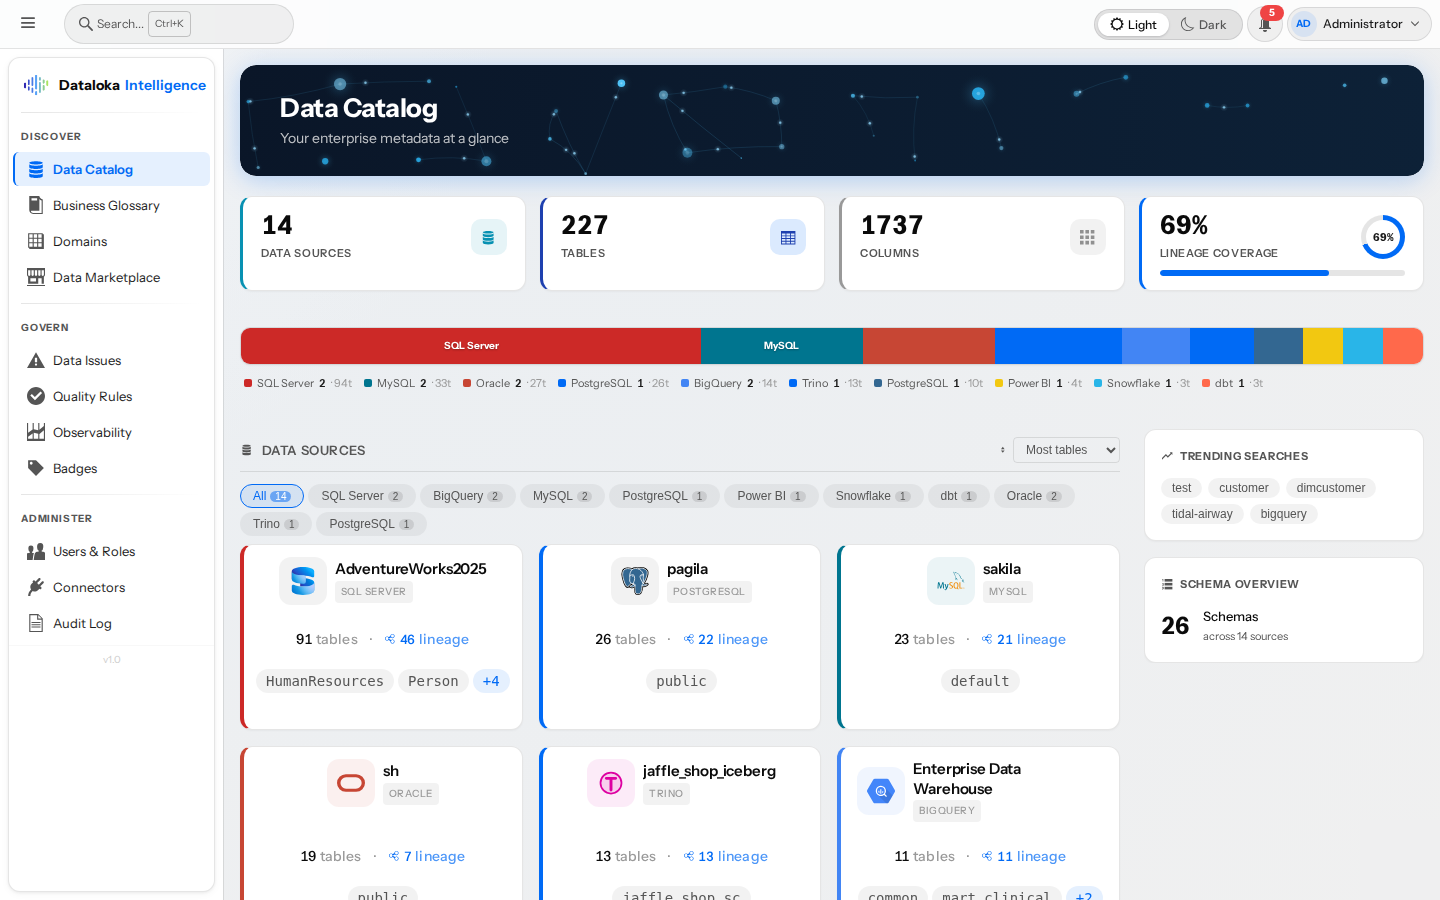
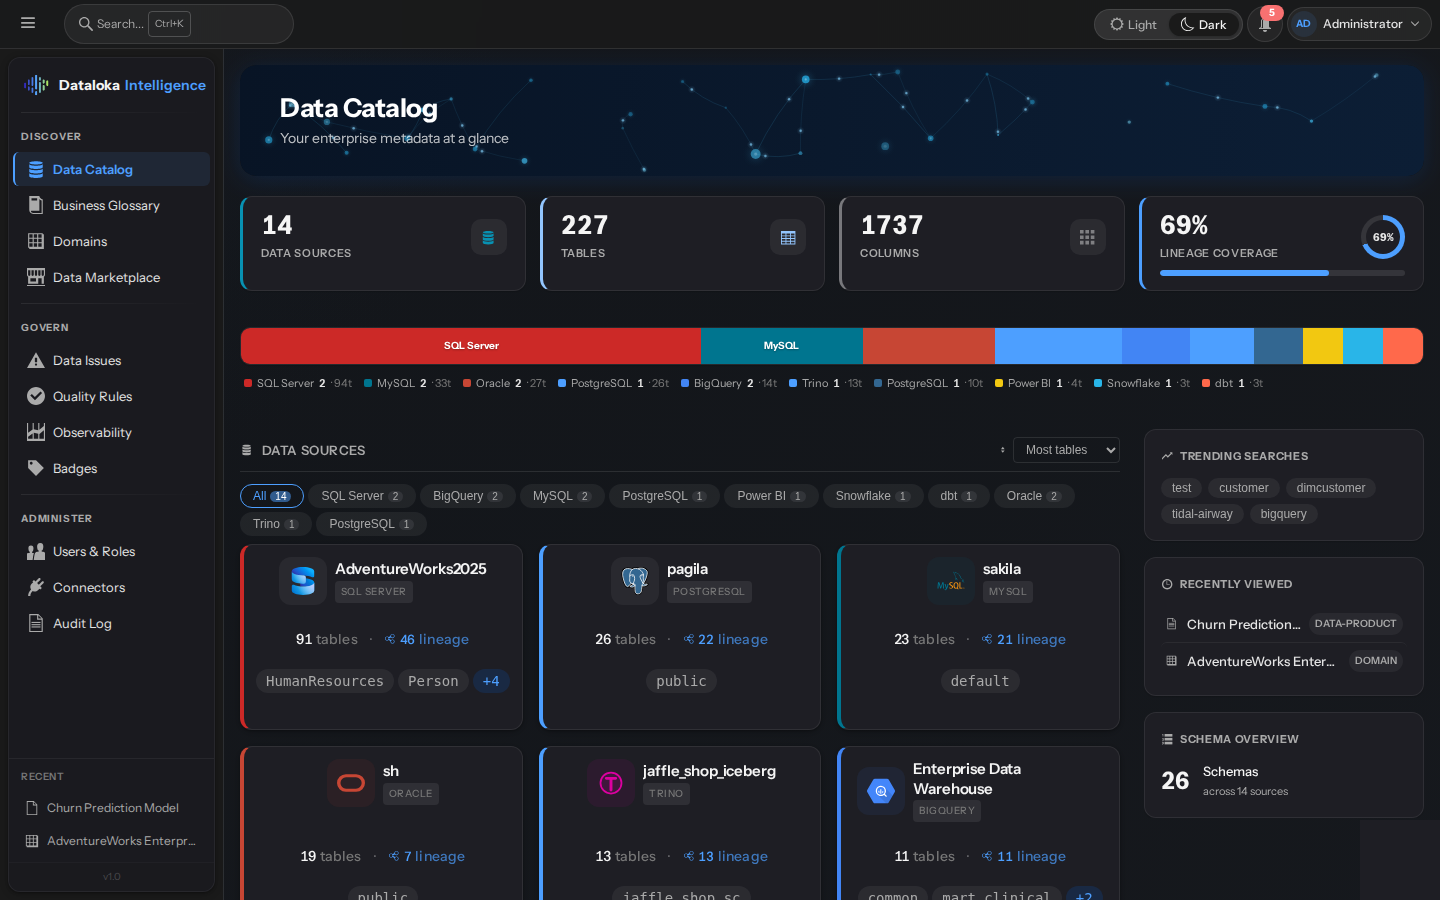
Your Enterprise Data Command Center

See every database, table, and column across your organization in one place. Business and technical teams finally share a single source of metadata repository — accelerating analytics and reducing costly data misunderstandings.

Data Catalog landing — enterprise data warehouse view with data sources, tables, columns, lineage coverage, trending searches, and platform breakdown
70+ Connectors
Auto-import metadata from databases, warehouses, BI tools, and ETL pipelines. Scheduled syncs keep your catalog always up to date without manual effort.
🔗
Interactive ER Diagrams
See table relationships, foreign keys, and column details in one interactive data modeling view.
📝
Rich Documentation
Business and technical metadata layers with inline rich-text editing. Give every table and column the context your analysts need.
🔄
Schema Change Tracking
Side-by-side diffs show exactly what changed and when. Never be surprised by upstream schema modifications again.
🗃️
Complete Object Coverage
Tables, views, stored procedures, functions, triggers, and sequences — every database object cataloged and searchable.
🔒
PII Protection
Sensitive columns are automatically masked in sample data previews. Only authorized stewards can unmask — keeping your organization compliant by default.
Table Detail
Table detail — overview with description, metadata, domain badges, business terms, and 8 dedicated tabs
Complete table profile at a glance — description, technical metadata, domain badges, linked business terms, steward assignments, and 8 dedicated tabs for Columns, Relations, Lineage, Schema History, Profiling, Quality, and Observability.
ER Diagram
Interactive ER diagram — visualize table relationships and foreign keys
Interactive entity-relationship diagrams with auto-layout, zoom, and pan. Understand your data model without leaving the browser.
Business Glossary

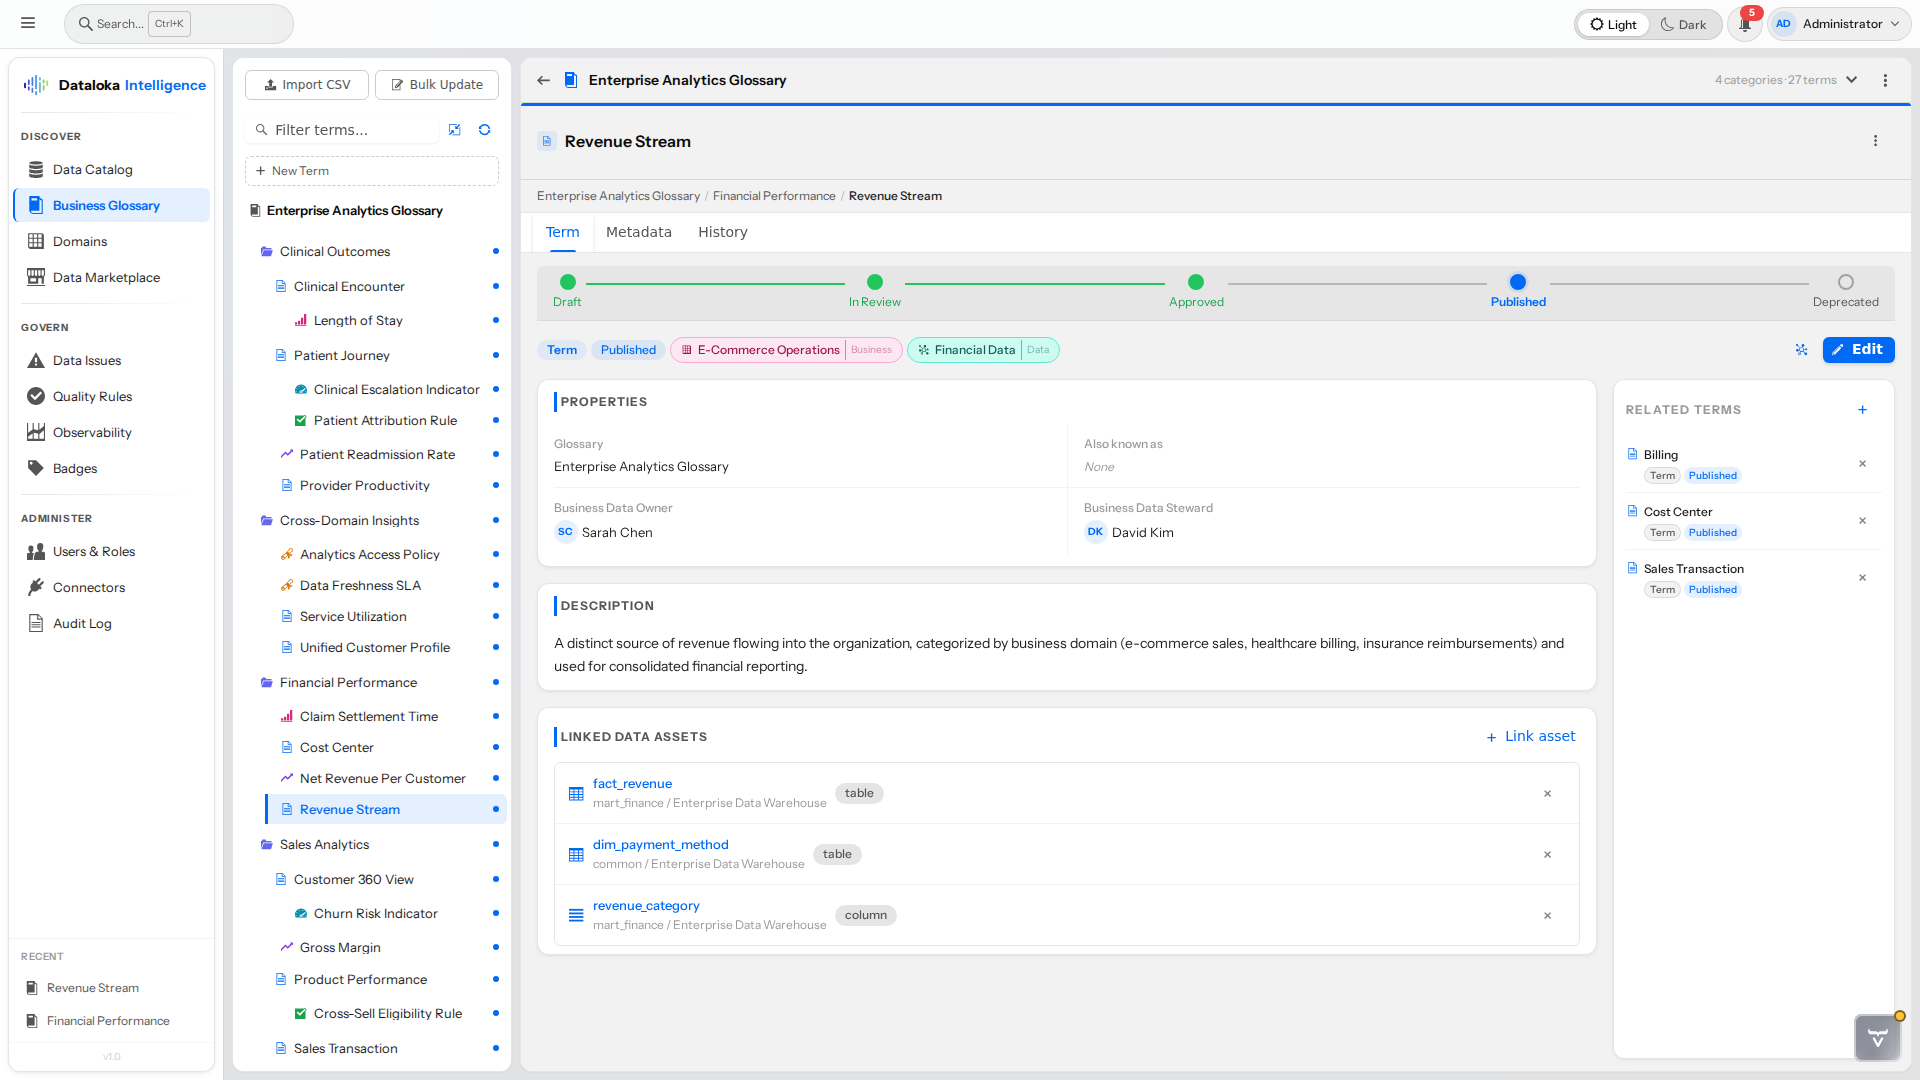
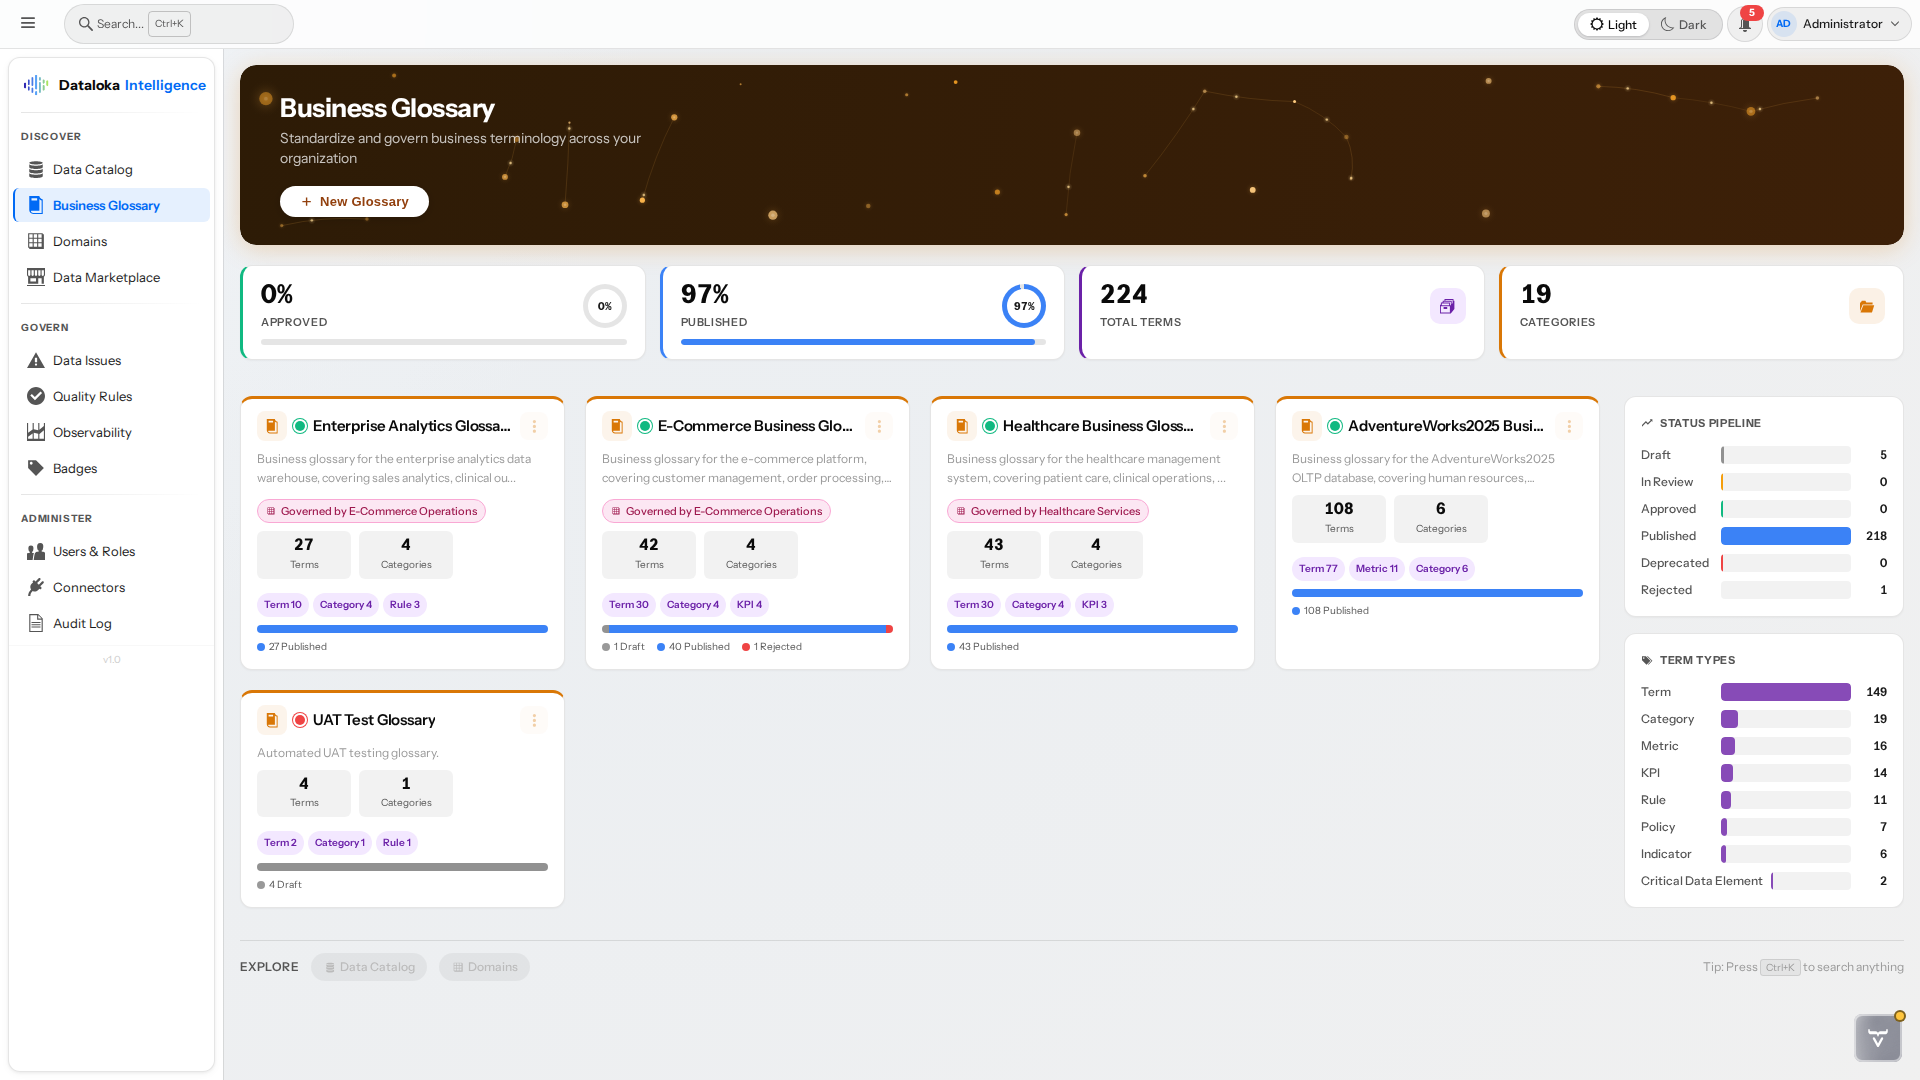
Standardize Your Business Language

Eliminate ambiguity across your organization. When “Revenue” means the same thing to Finance, Sales, and Engineering, decisions get faster and reporting gets reliable.

Business term detail — linked data assets, related terms, and governance status
📑
Hierarchical Term Catalog
Organize terms into categories, KPIs, policies, metrics, and custom types. Collapsible tree navigation makes even large glossaries easy to manage.
🔗
Business-to-Data Mapping
Map business terms directly to physical tables and columns — bridging the gap between business meaning and technical implementation.
🌐
Interactive Relationship Graph
Visualize how terms, domains, tables, and columns connect in an interactive canvas with depth controls, zoom, and color-coded node types.
Governance Workflow
Draft → In Review → Approved → Published with full audit trail. Only Published terms can be linked to assets — ensuring terminology quality.
📤
Bulk Import & CDE Propagation
Onboard existing glossaries via CSV with validation wizard. Terms marked as Critical Data Elements auto-badge every linked column across the catalog.
Glossary Dashboard
Business Glossary dashboard — multiple glossaries with term counts, status pipeline, and type distribution
Manage multiple glossaries across the enterprise. At-a-glance metrics show term counts, approval status pipeline, and type distribution — so governance leaders always know where they stand.
Term Relationship Canvas
Interactive relationship graph — terms, domains, tables, and columns connected as a knowledge graph
Visualize how business terms connect to data domains, tables, and columns in an interactive canvas. Depth controls, zoom, and color-coded node types make complex relationships easy to explore.
Domain Management

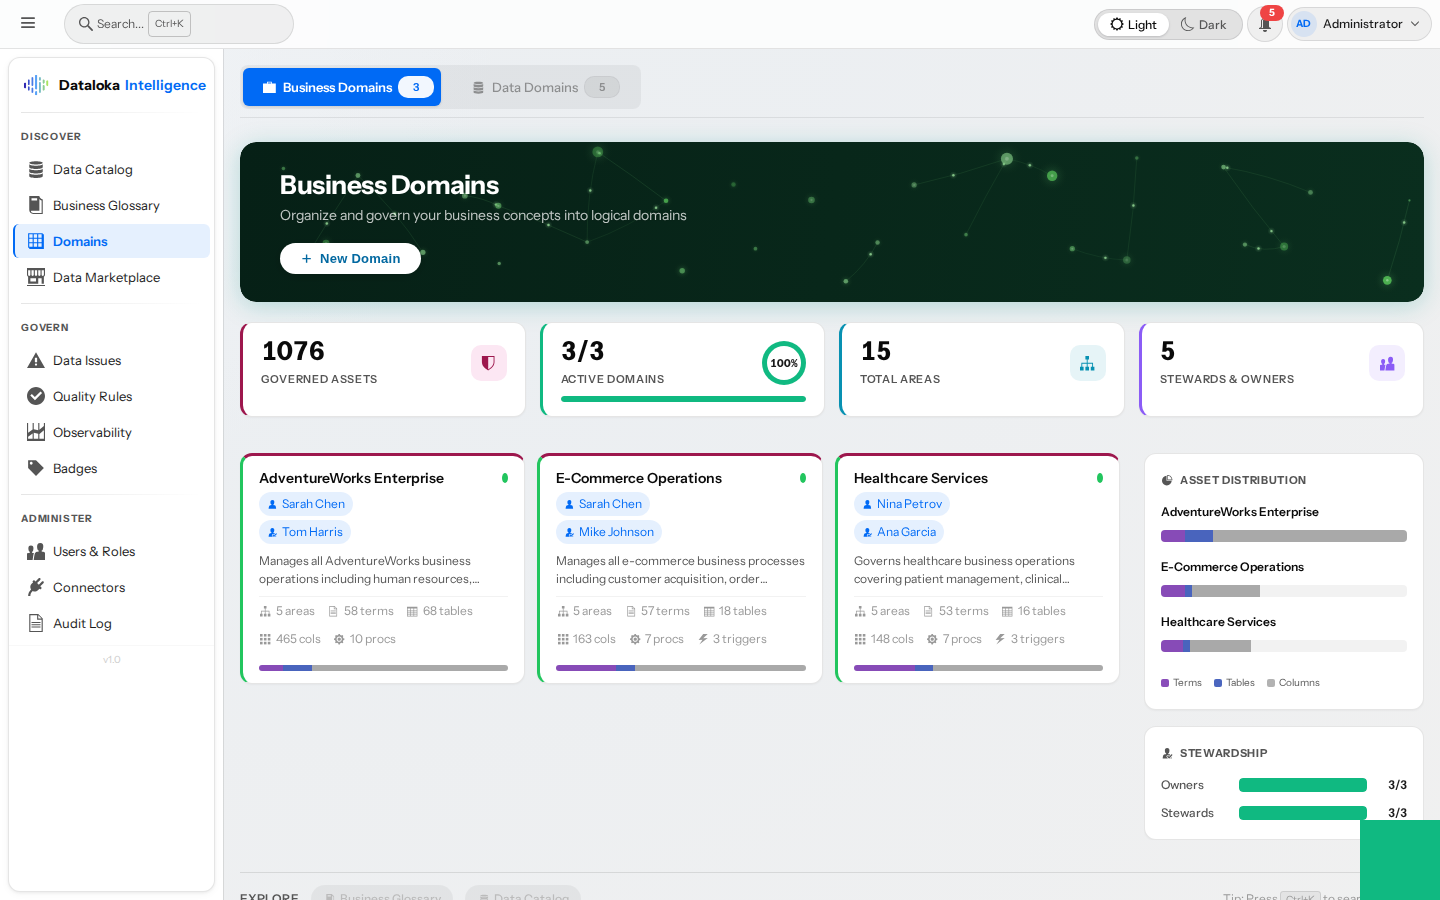
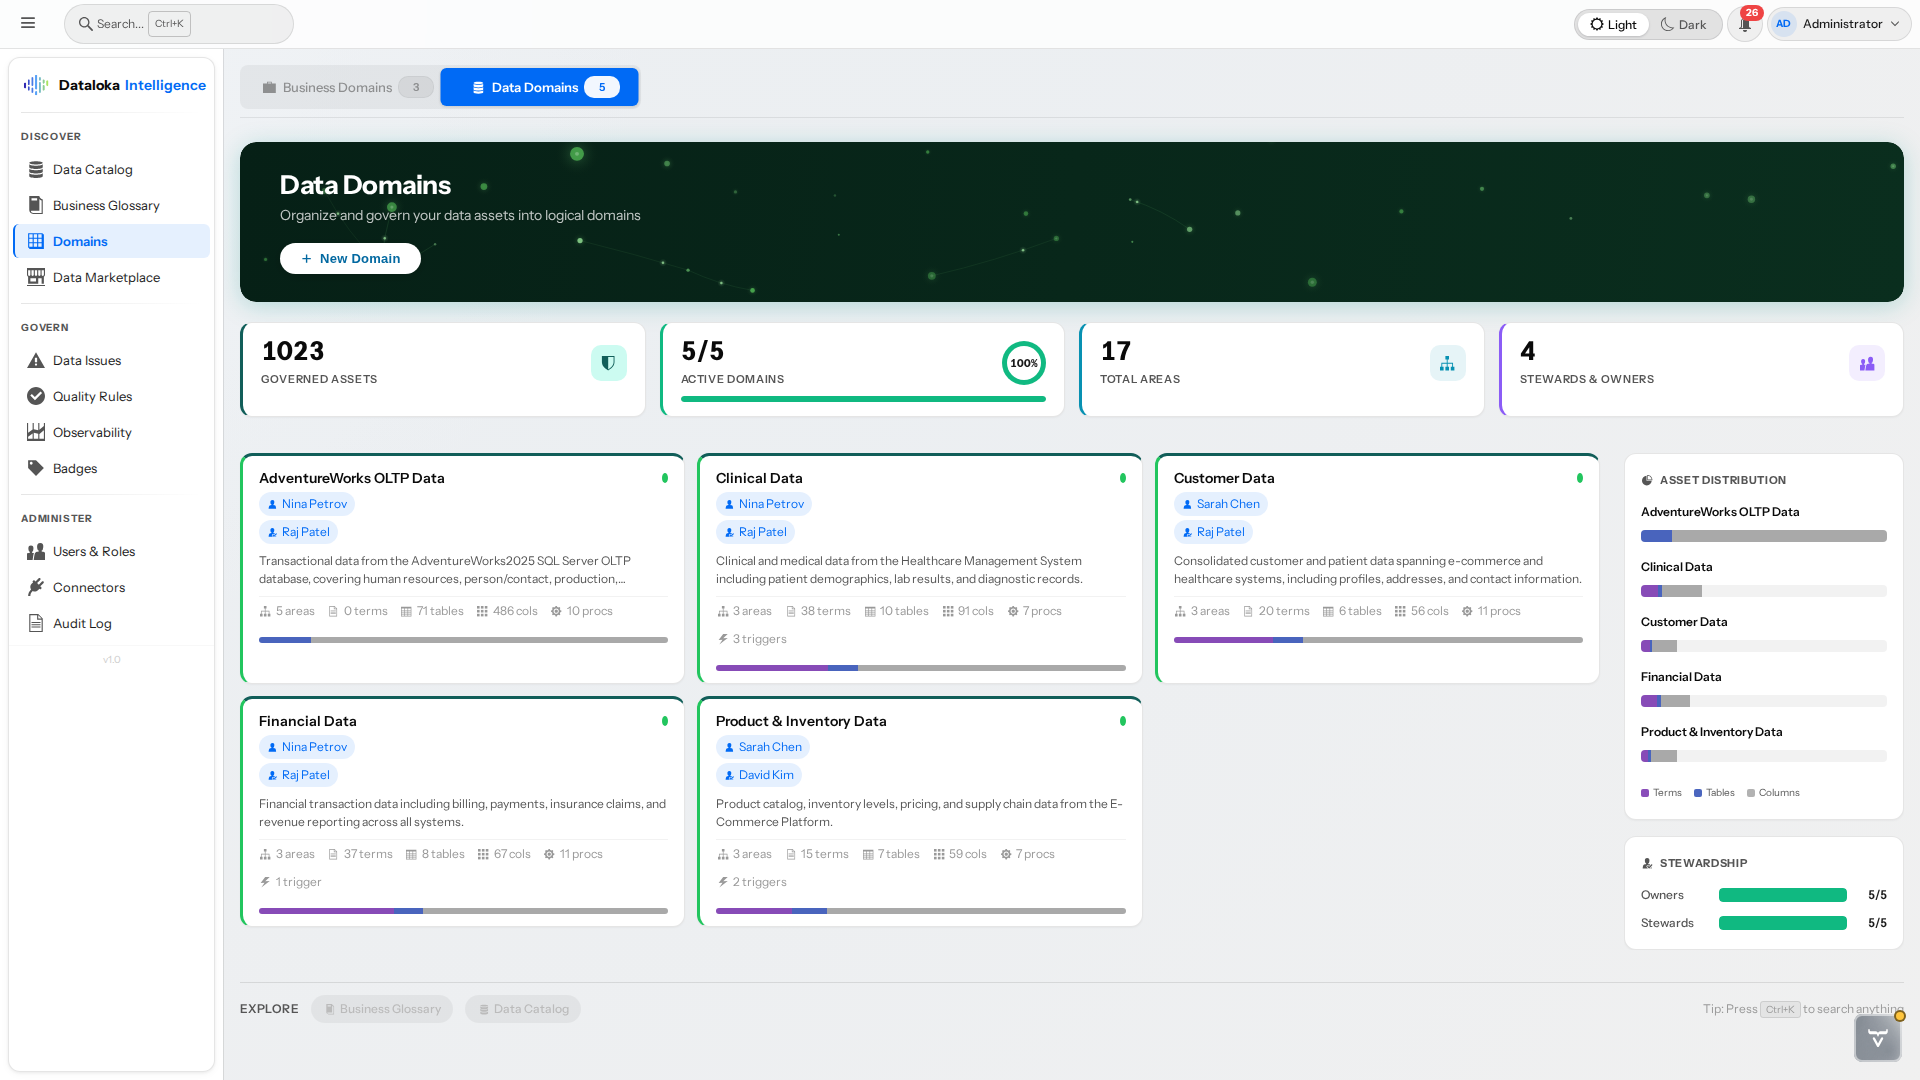
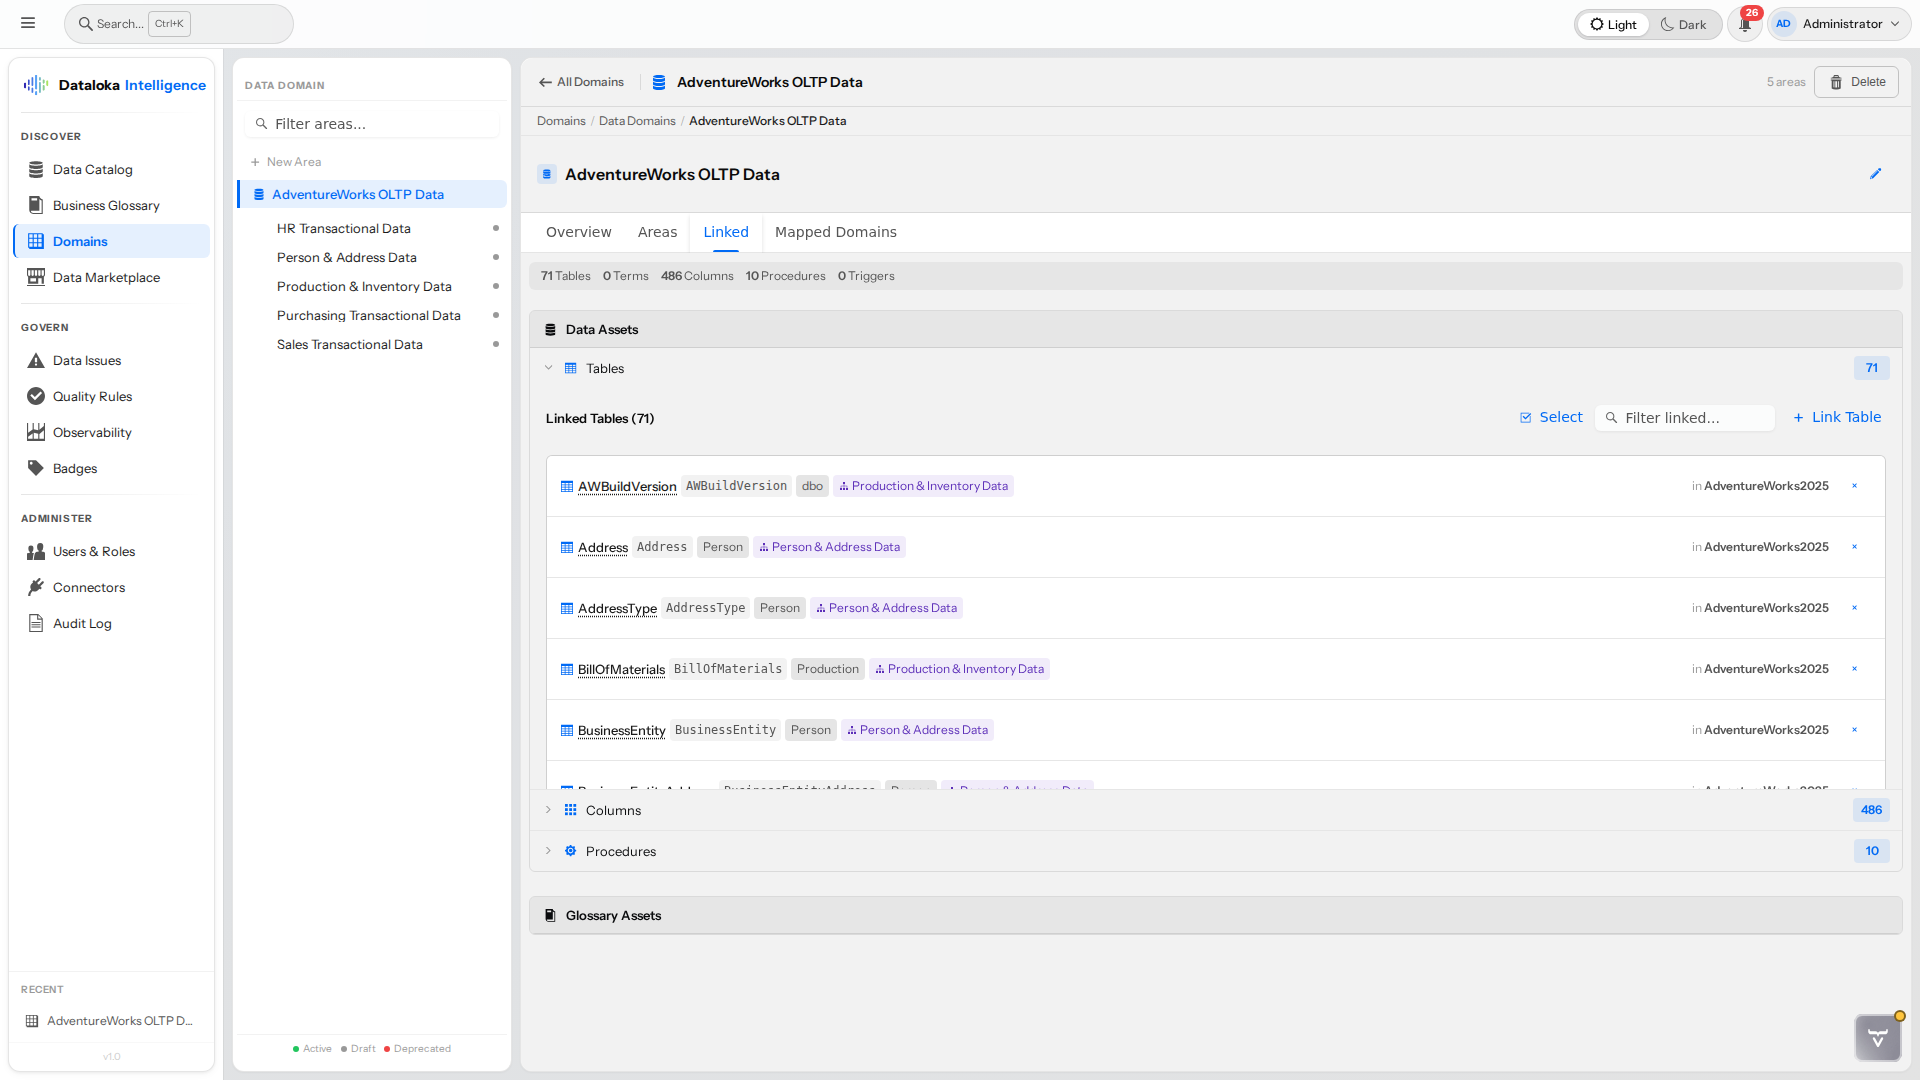
Organize Data by Business Context

Structure data the way your business thinks. Map Business Domains (Sales, Finance, HR) to Data Domains (Customer, Product, Transaction) so every stakeholder sees data in their context.

Domain overview — business and data domains organized hierarchically
🌐
Business & Data Domains
Align with your Enterprise Architecture framework. Business domains represent critical business processes capabilities, data domains represent business data assets.
🗒️
Unlimited Hierarchy
Drag-and-drop nesting that adapts to evolving organizational structures. No artificial depth limits.
🔗
Cross-Domain Mapping
Link business processes to the data that powers them. See which data domains support which business functions at a glance.
👥
Domain-Scoped Governance
Assign stewards, owners, and policies per domain. Clickable domain badges appear across catalog, glossary, marketplace, and search.
Data Domains
Data Domains — 5 technical domains with 1023 assets, distribution metrics, and governance coverage
Organize your technical data estate into Data Domains — Sales Data, Customer Data, Financial Data, and more. Each domain card shows asset counts, linked areas, and governance distribution at a glance.
Linked Assets
Linked Assets — tables, columns, procedures, and glossary terms connected to a data domain
See every data asset linked to a domain — tables, columns, stored procedures, and glossary terms in one view. Filter by data asset type and link new data assets directly from the domain detail page.
Data Profiling

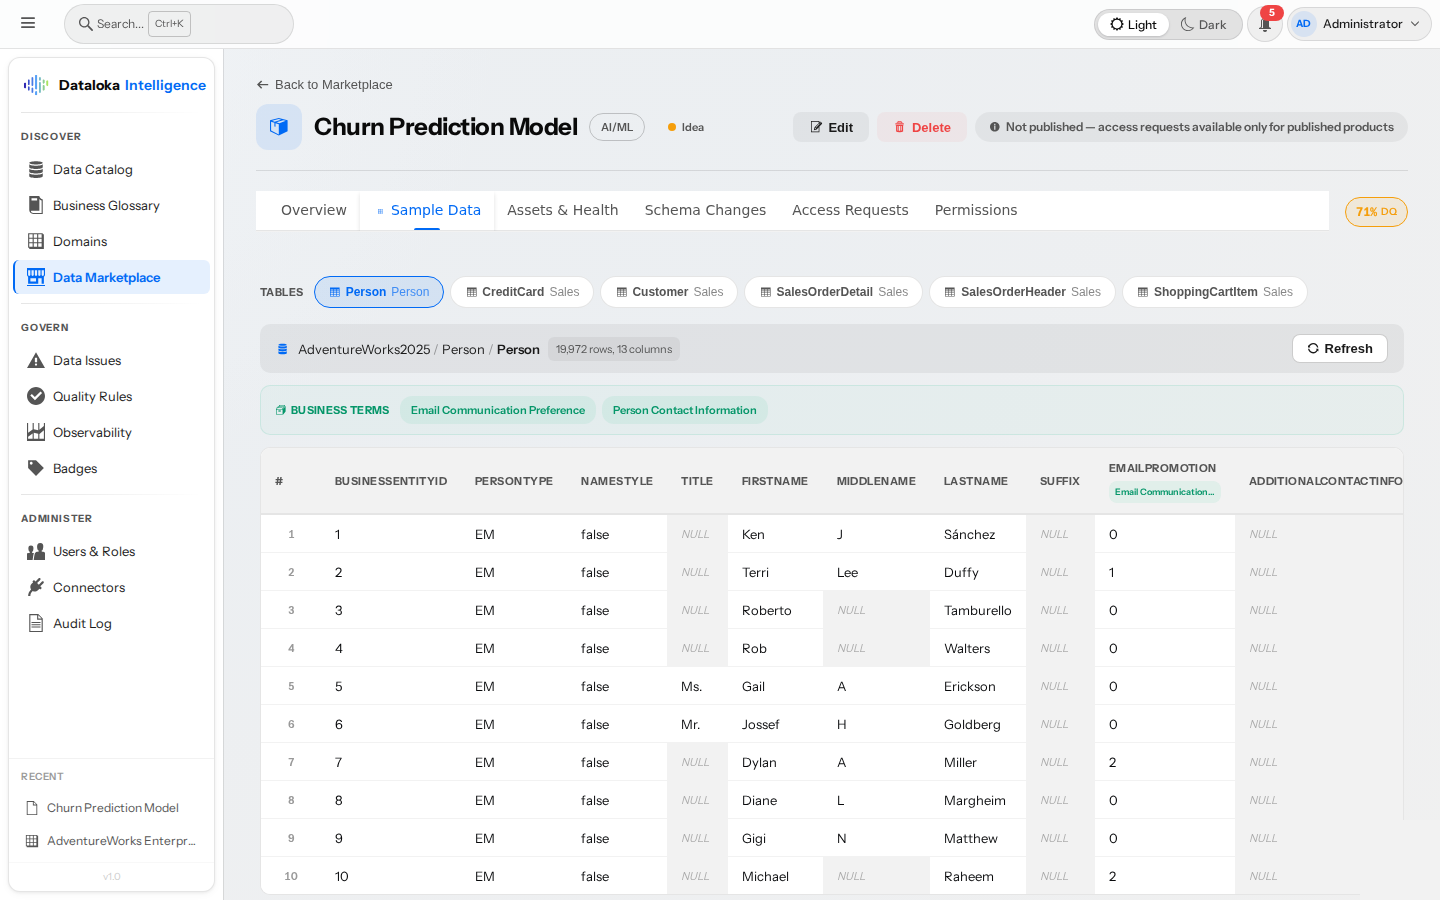
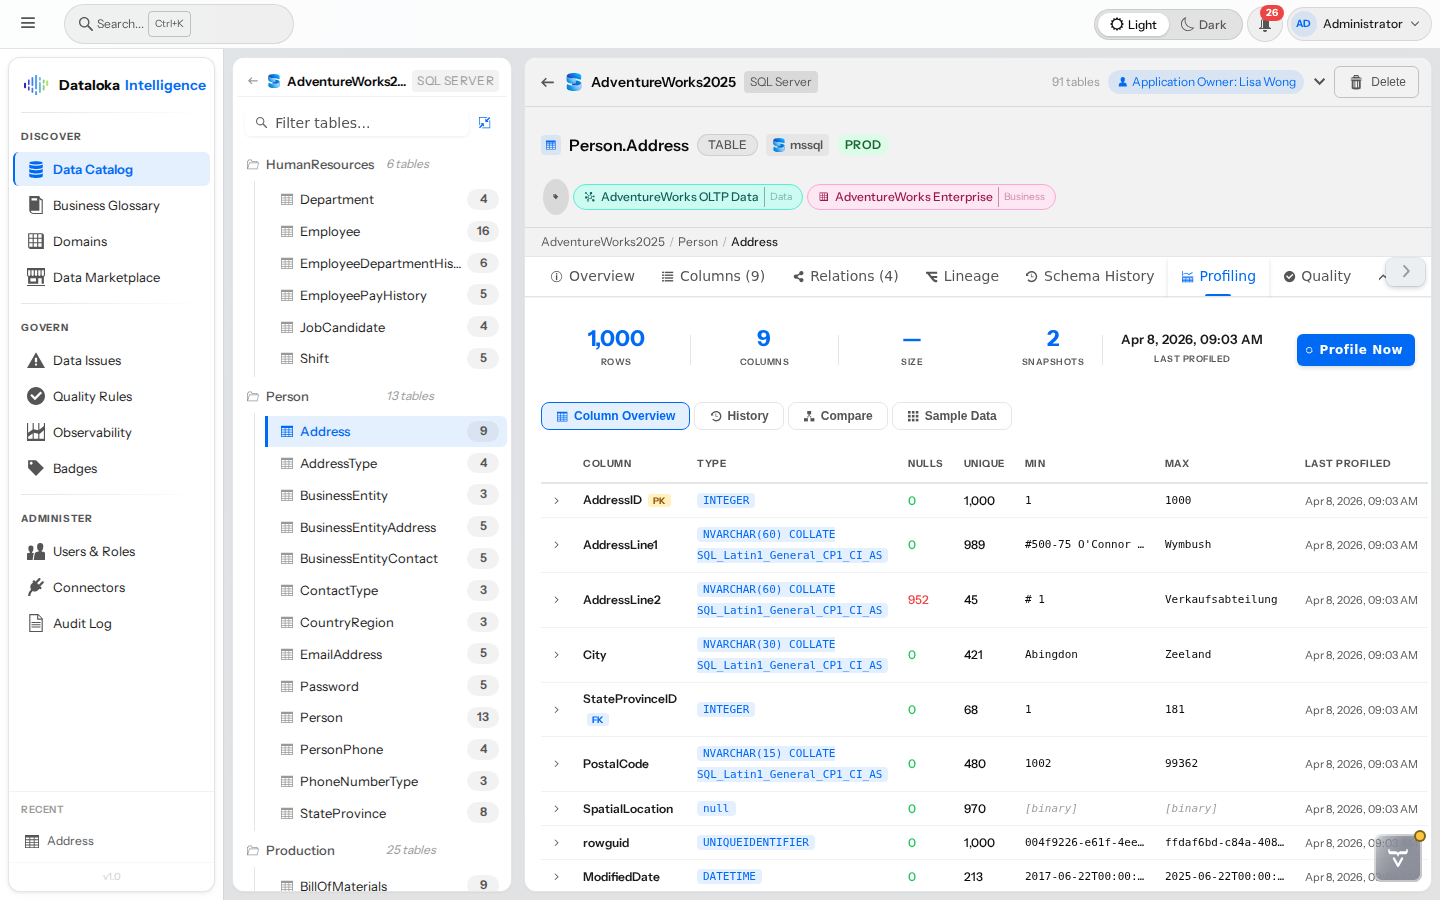
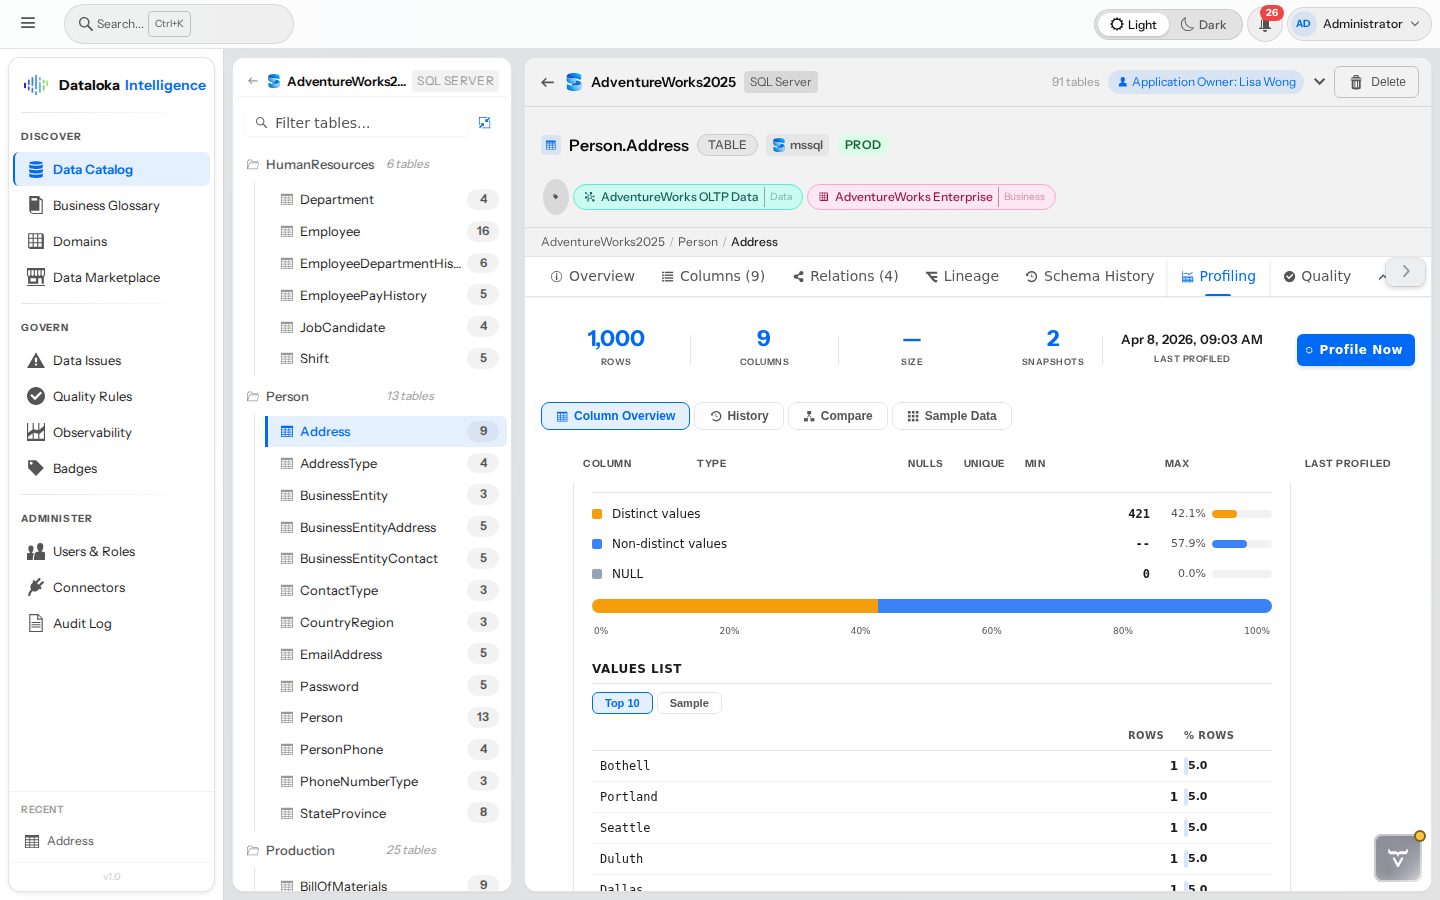
Understand Your Data Before You Use It

Get instant statistical insights into every column. Profiling gives your team the confidence to build on data they truly understand, and catches anomalies before they become costly mistakes.

Column statistics — null rates, uniqueness, min/max, mean, median, and standard deviation for every column
📊
One-Click Profiling
Connect to 28+ data platforms and profile any table on demand. Results in seconds, not hours — no ETL pipelines required.
📈
Column-Level Statistics
Null rates, empty values, uniqueness, min/max, mean, median, and standard deviation for every column — the full statistical picture.
📊
Visual Distribution Charts
Histograms, stacked bars, and value frequency analysis. Type-aware rendering for numeric, string, and date columns.
📅
Profile History & Comparison
Track how data quality changes over time with snapshot history and side-by-side comparison showing per-column deltas.
🔒
PDP/GDPR-Ready
PII-tagged columns display as *** for all users. Only selected Data Stewards can selectively unmask columns they govern.
Visual distribution charts — stacked bars, histograms, and value frequency analysis
Data Quality & Observability

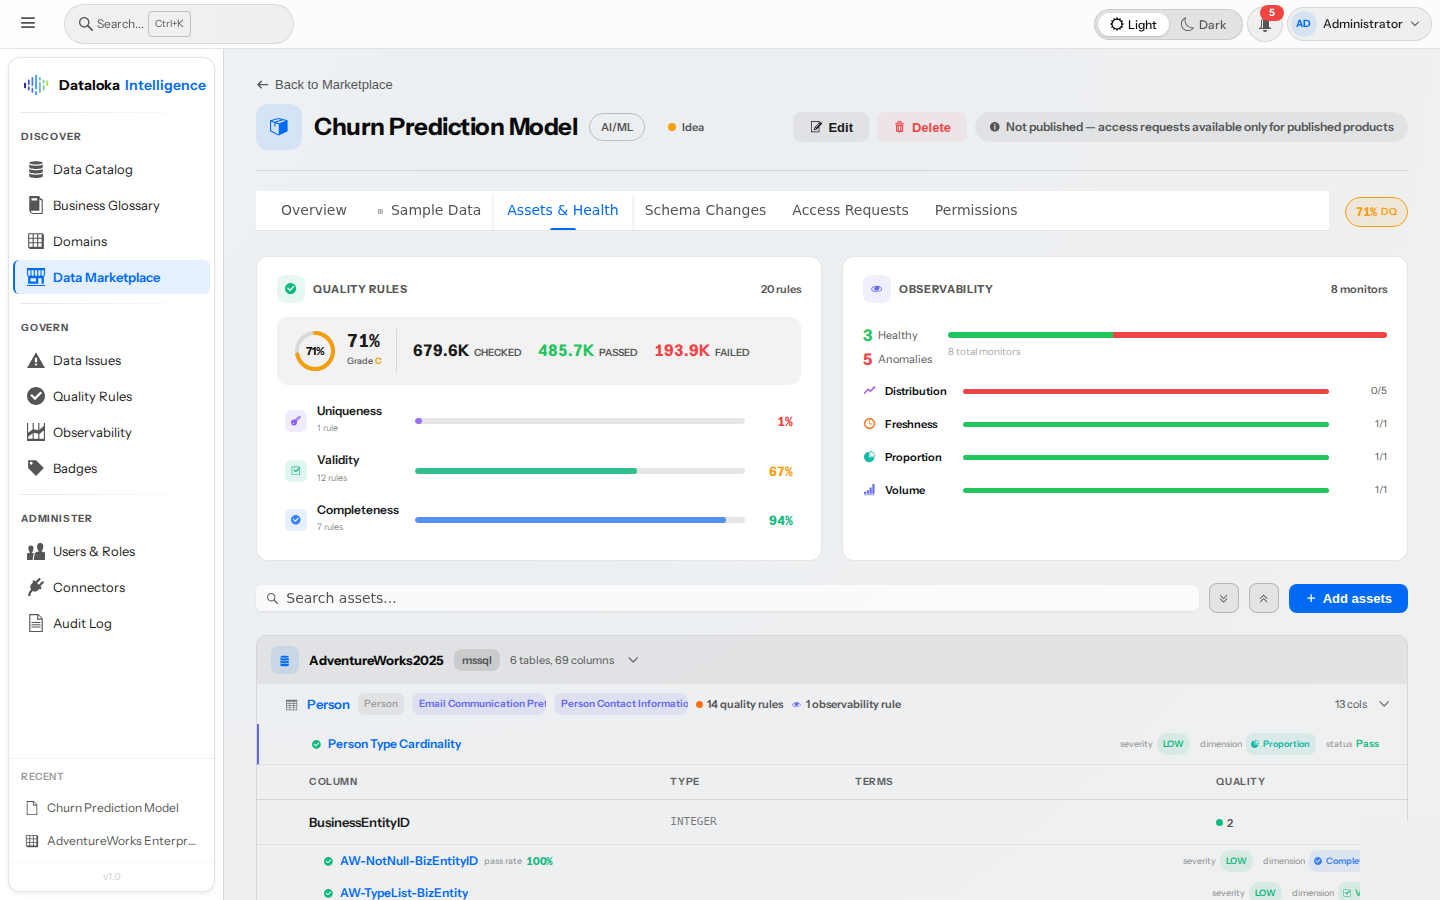
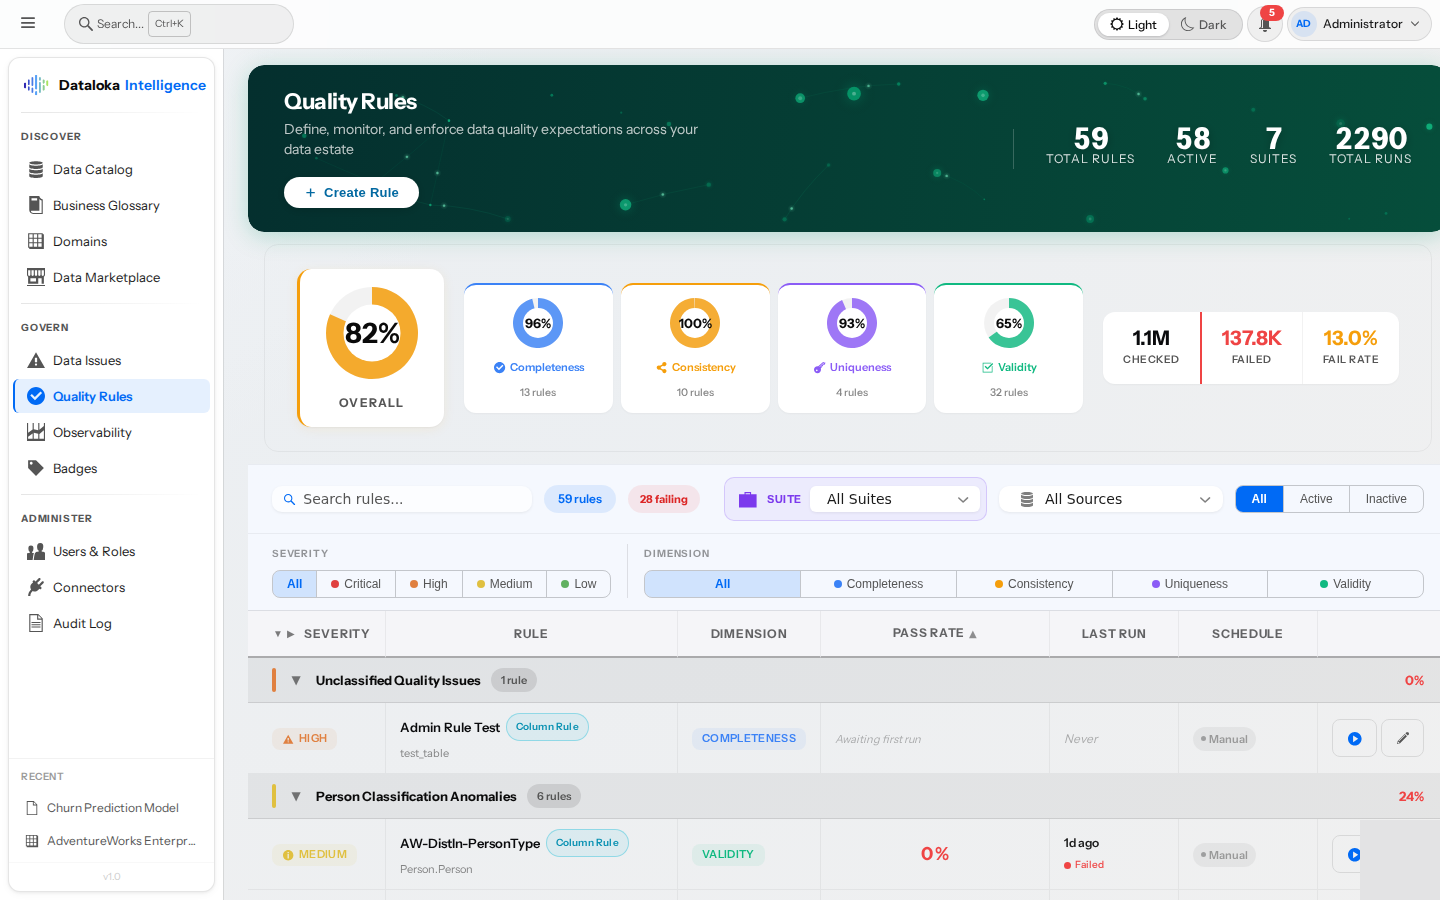
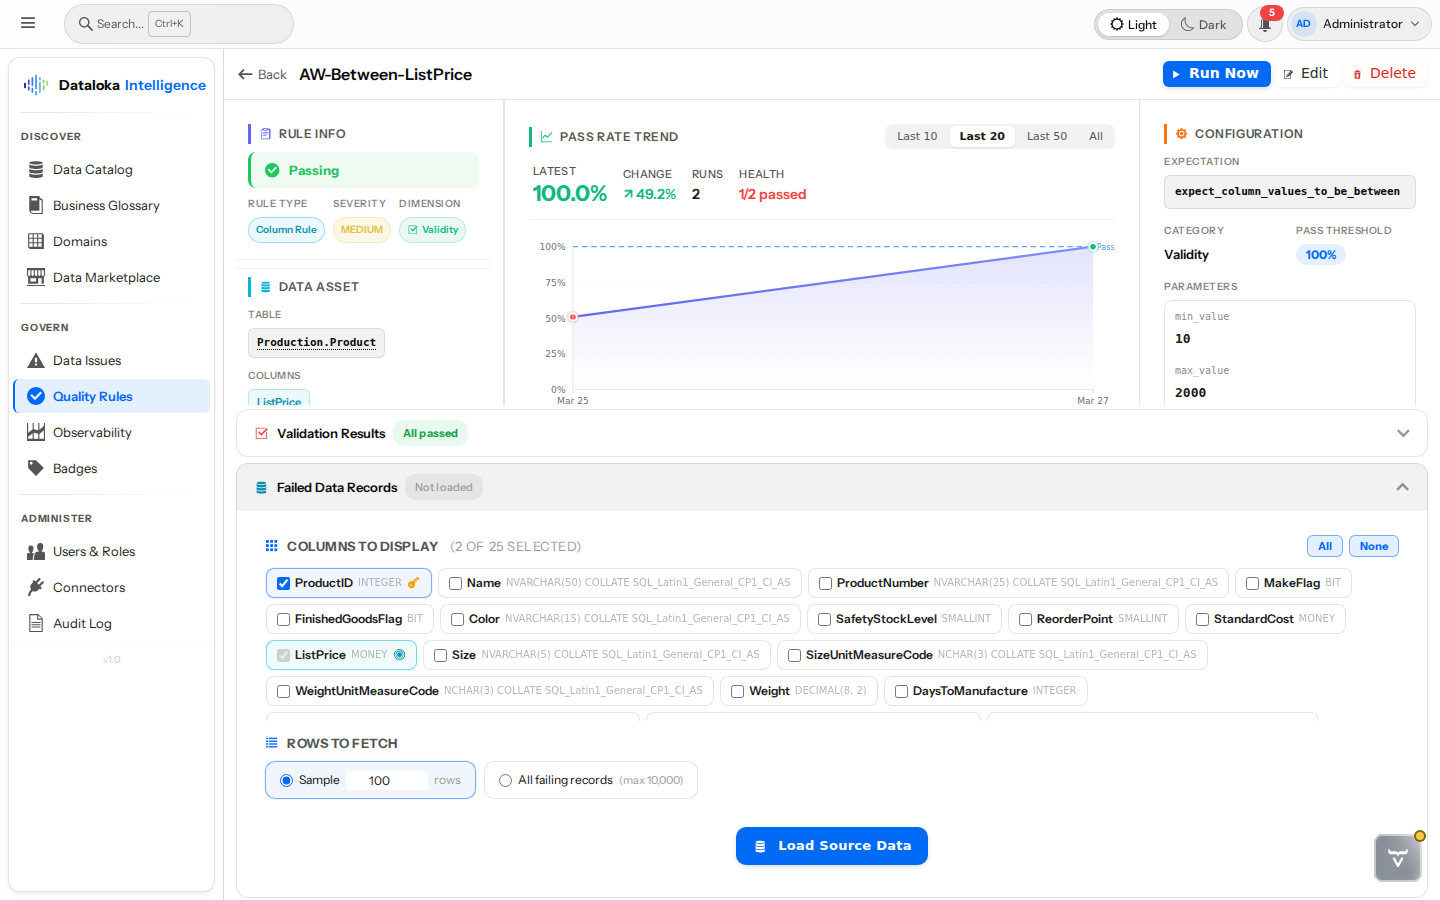
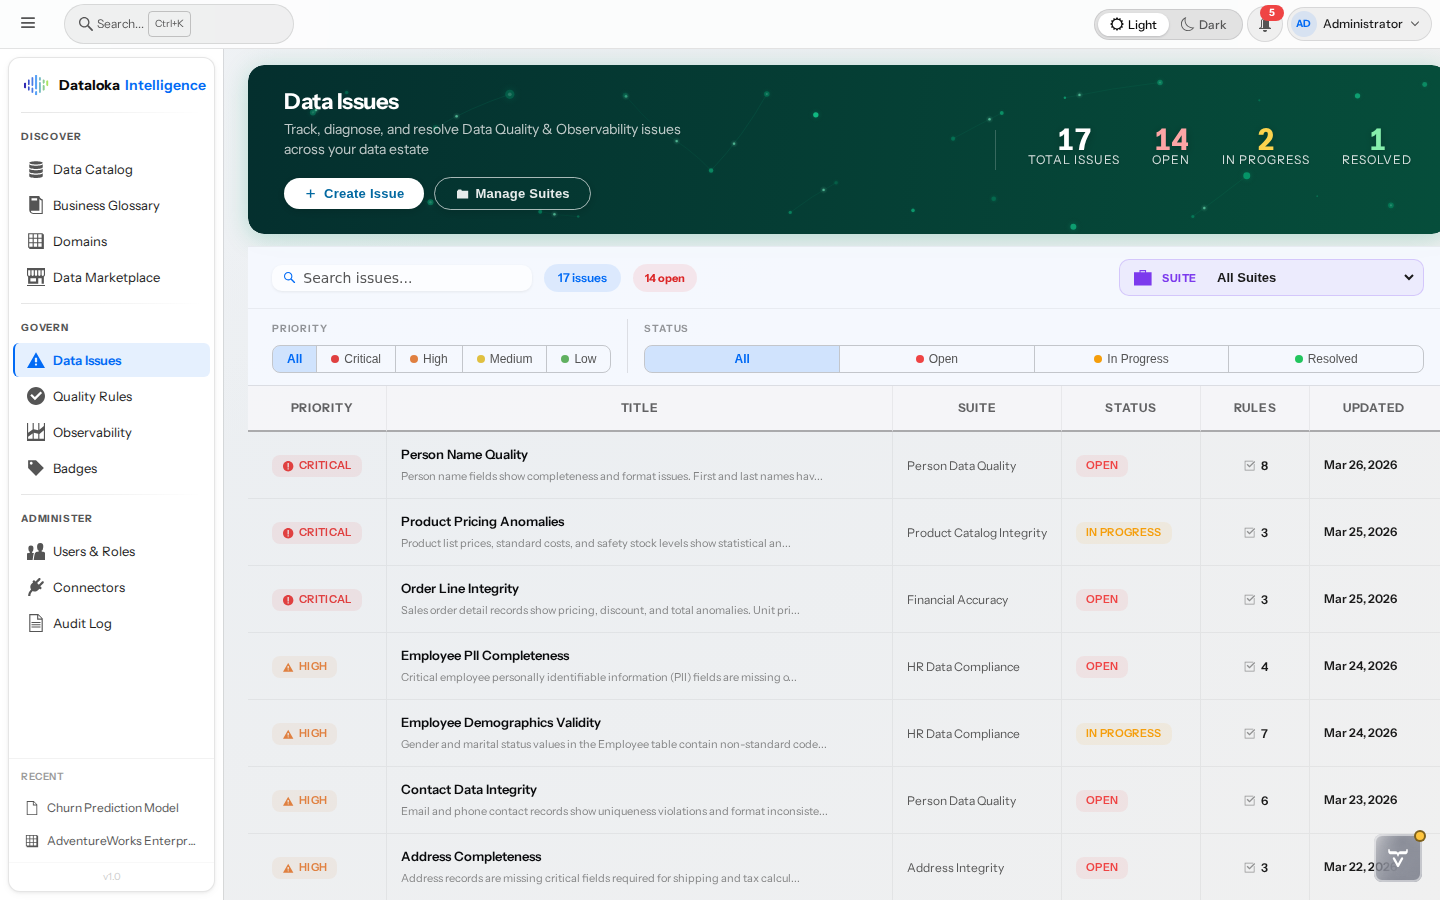
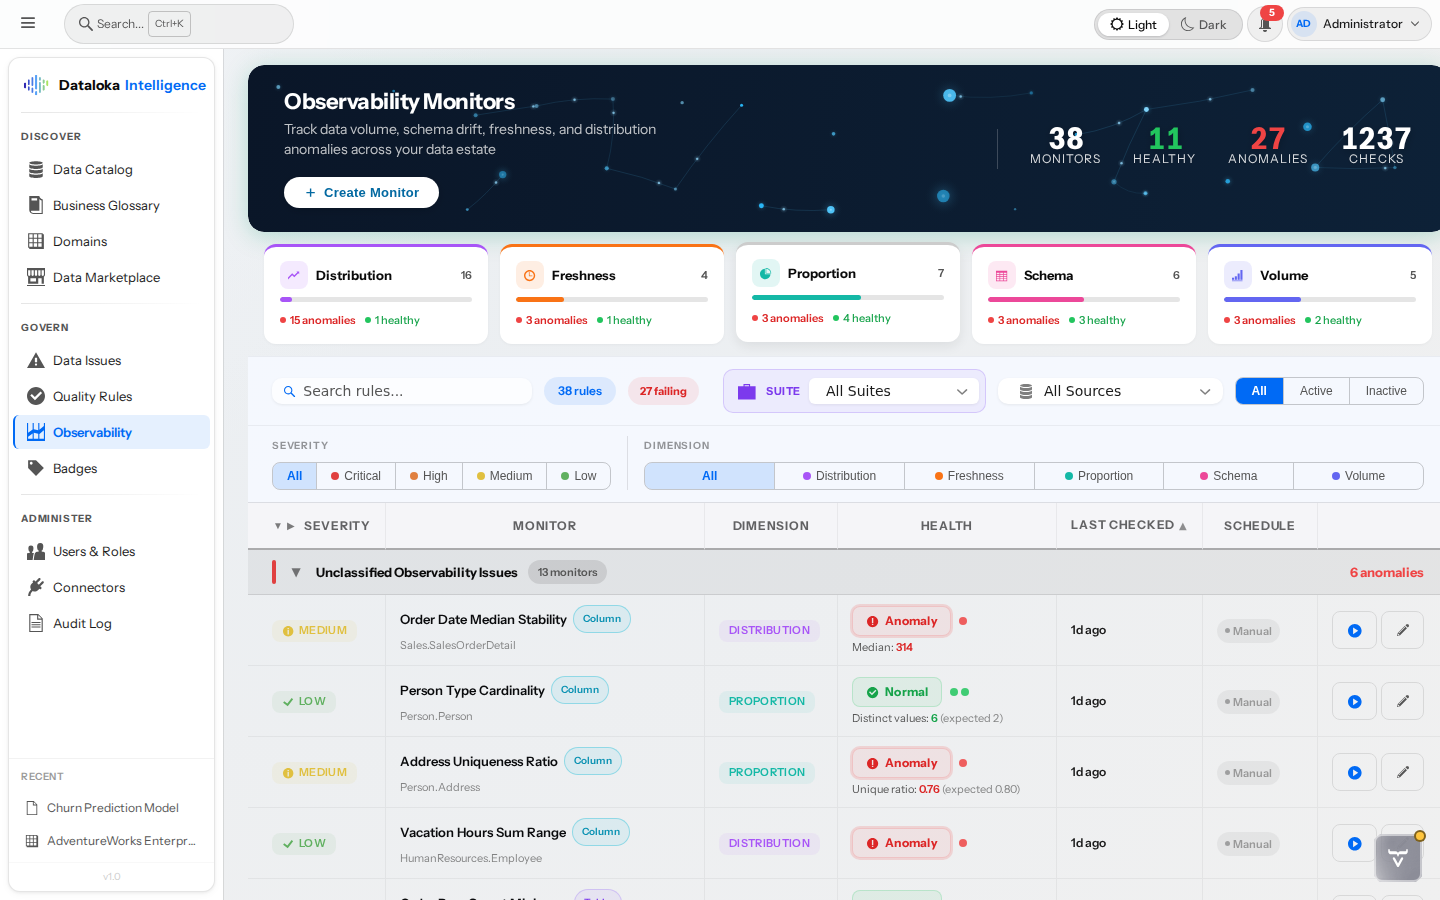
Protect the Data Your Business Depends On

Bad data costs enterprises millions every year in wrong decisions, failed reports, and lost customer trust. Dataloka Intelligence catches quality problems before they reach your dashboards — with 80+ rule templates, automated monitoring, and a built-in remediation workflow that keeps your entire data estate healthy.

Data Quality Rules — unified dashboard with pass rates, severity, and dimension grouping
80+ Quality Rule Templates
Covers 8 DAMA DMBOK dimensions — completeness, validity, uniqueness, consistency, accuracy, timeliness, integrity. No coding required to get started. Additional custom SQL rules still supported.
👁️
Data Observability Monitors
Detect freshness delays, volume anomalies, schema drift, distribution shifts, and proportion changes — before downstream consumers are impacted.
🔧
Data Issue Management
Track every quality problem with root cause analysis and corrective & preventive remediation wikis. Linked to the rules that detected them for full traceability.
📅
Automated Scheduling & Escalation
Cron-based rule execution with CDE auto-escalation — critical data elements get priority attention and immediate stakeholder notification.
📊
28 Data Platform Support
Run quality and observability rules on PostgreSQL, Snowflake, BigQuery, Oracle, MongoDB, and 23 more platforms — one consistent quality layer across your entire stack.
🔒
Secure Failed-Records Investigation
When inspecting failed records, sensitive columns stay masked automatically. Teams troubleshoot quality issues without ever exposing personal data — PDP Law and GDPR compliant.
Rule Detail & Trends
Rule Detail — pass rate trends, configuration, and failed data records
Drill into any rule to see pass-rate trends over time, rule configuration, severity level, and the exact data record rows that failed to comply with respective rules — giving your team the context to fix issues fast.
Data Issues
Data Issues — track, investigate, and remediate quality problems
Every quality problem gets a dedicated issue with root cause analysis, corrective actions, and preventive remediation plan — building institutional knowledge that prevents repeat failures.
Data Observability
Know When Your Data Is Late, Wrong, or Changed
FreshnessVolumeSchema DriftDistributionProportion
Data Observability — freshness, volume, and schema drift monitors
Monitor 5 observability dimensions across all your data sources. Freshness countdowns catch stale data before it reaches dashboards, volume monitors flag unexpected row count changes, and schema drift detection alerts you to structural changes — all with traffic-light status indicators and automated scheduling.
Data Lineage

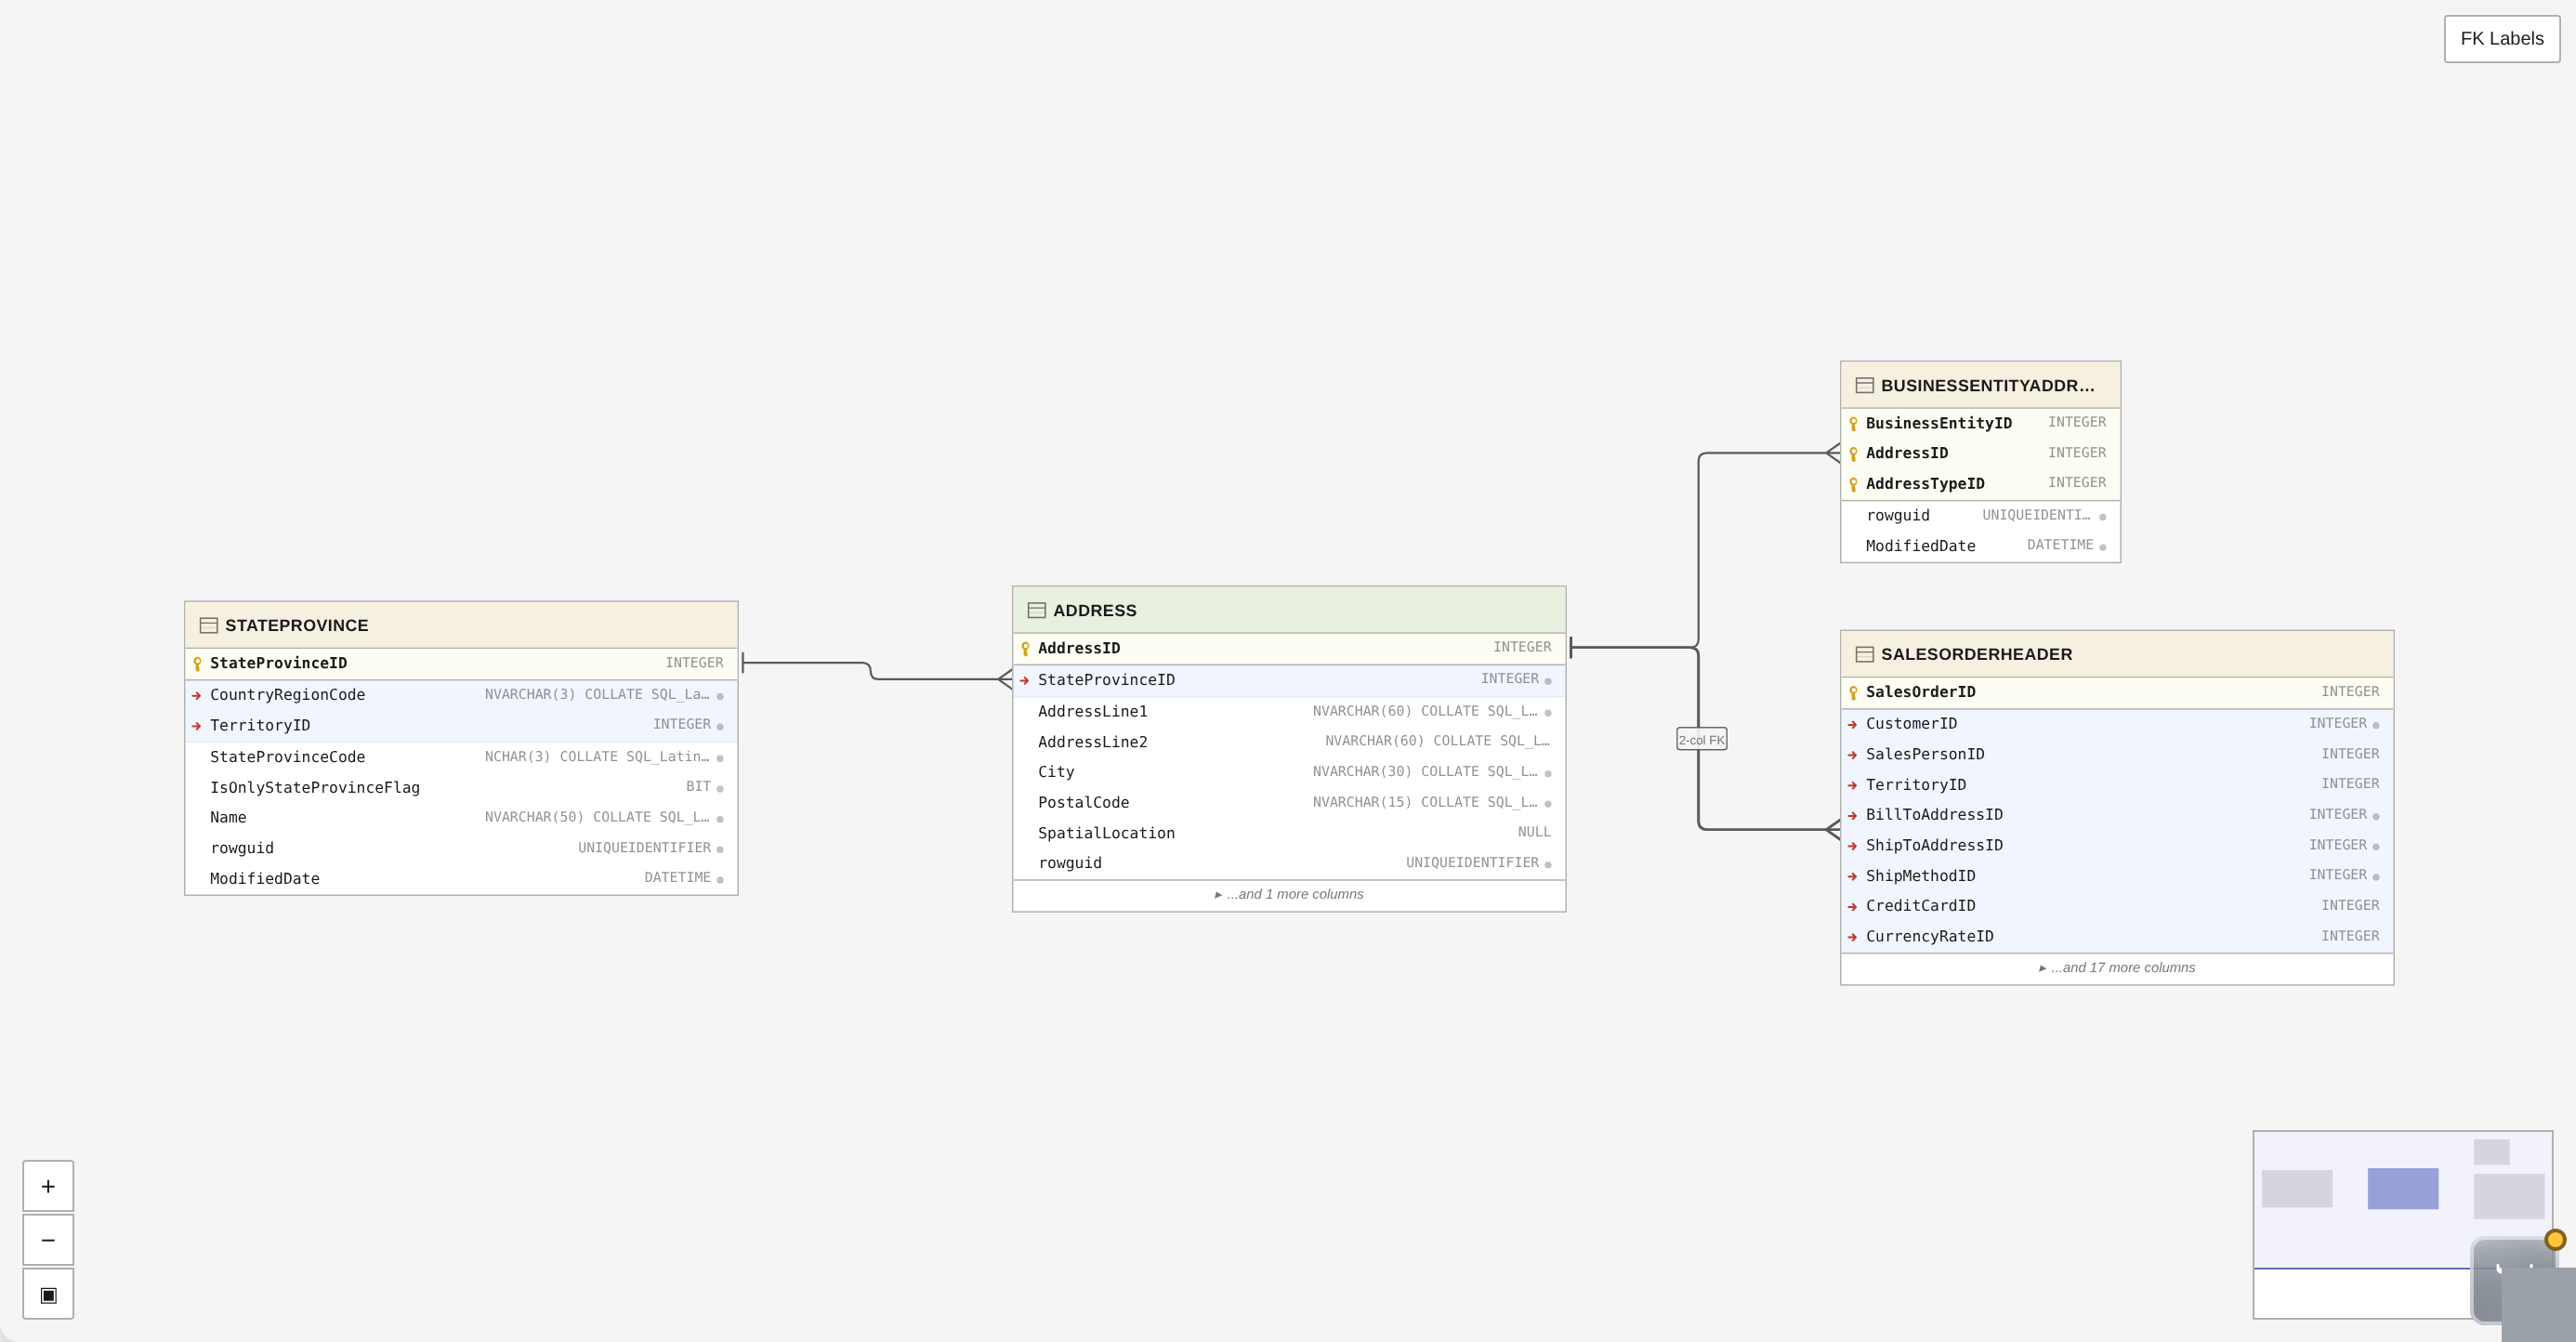
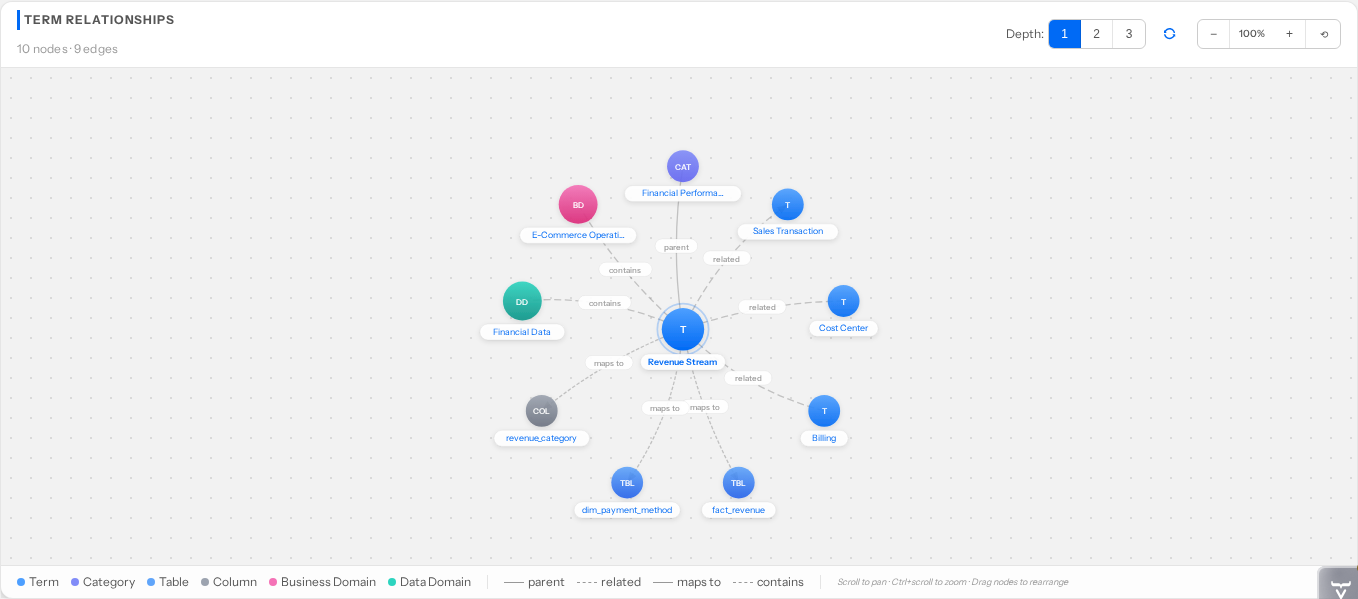
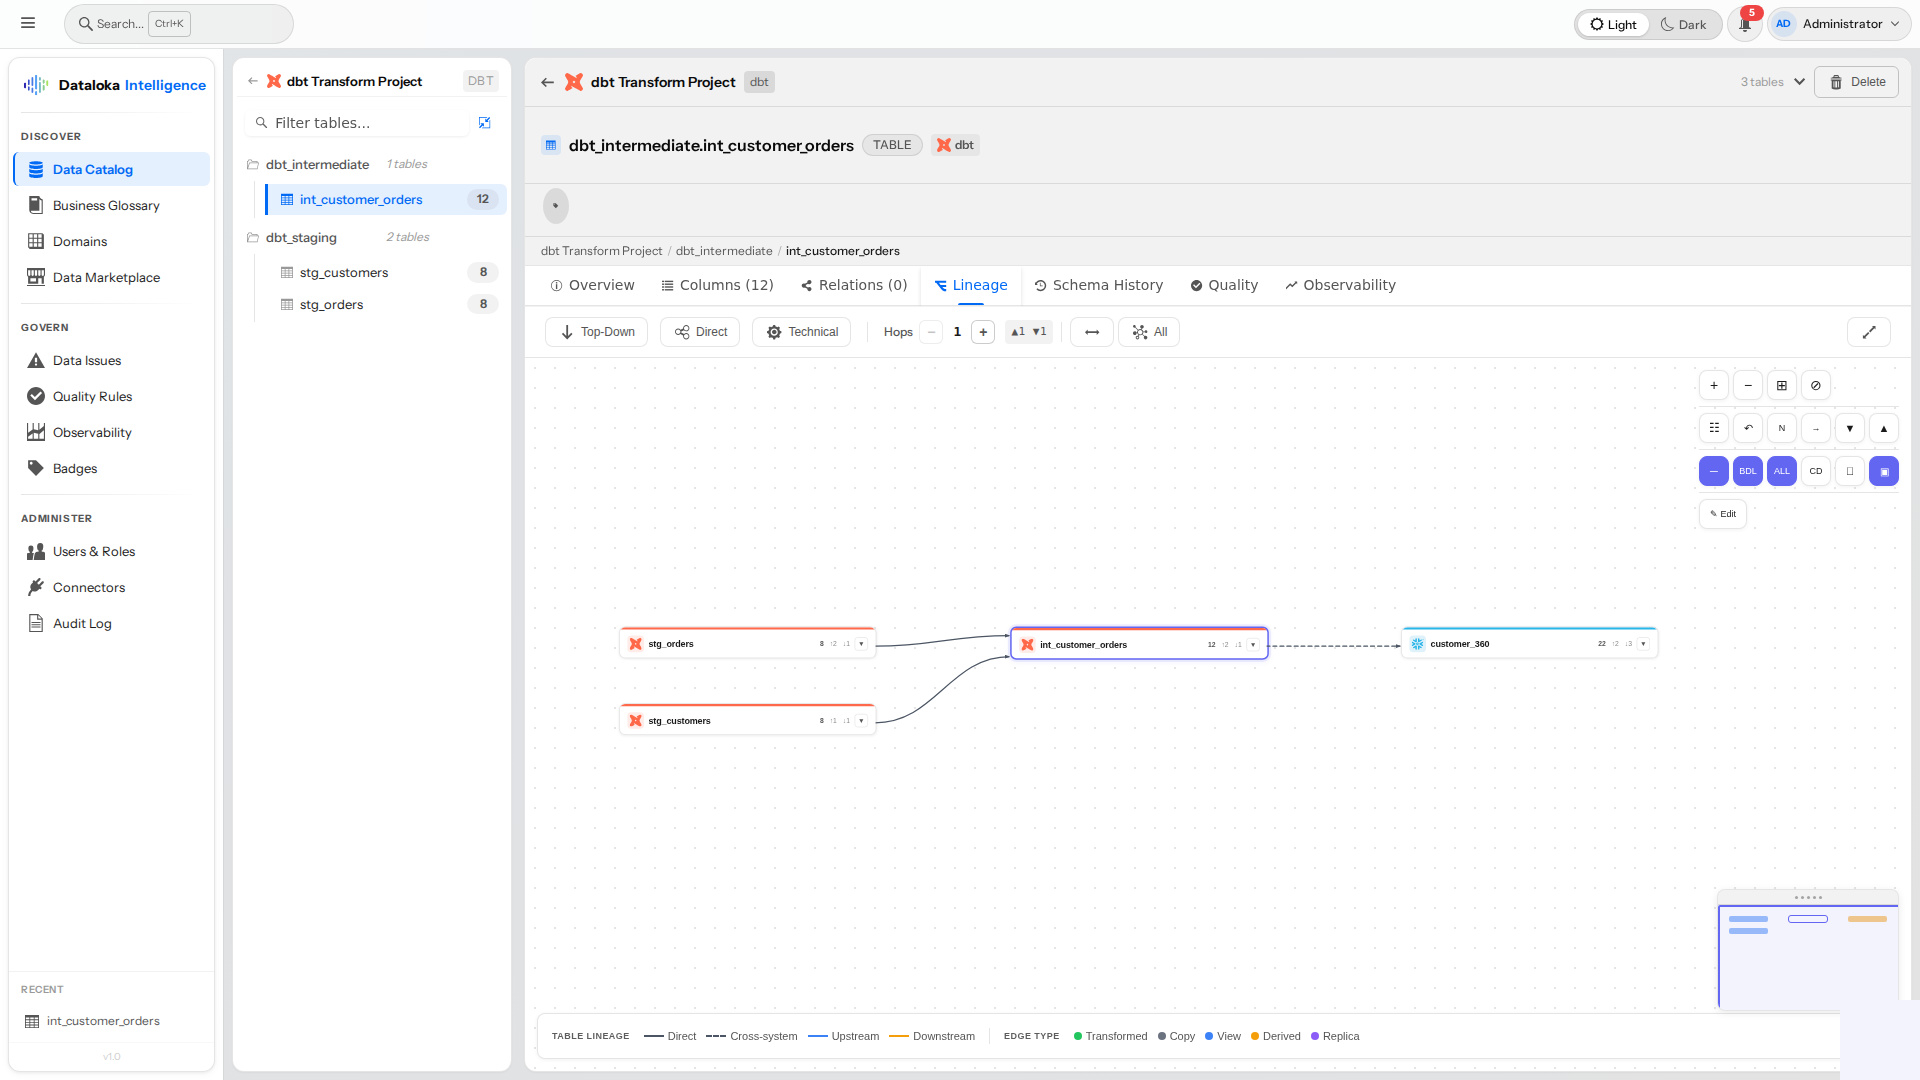
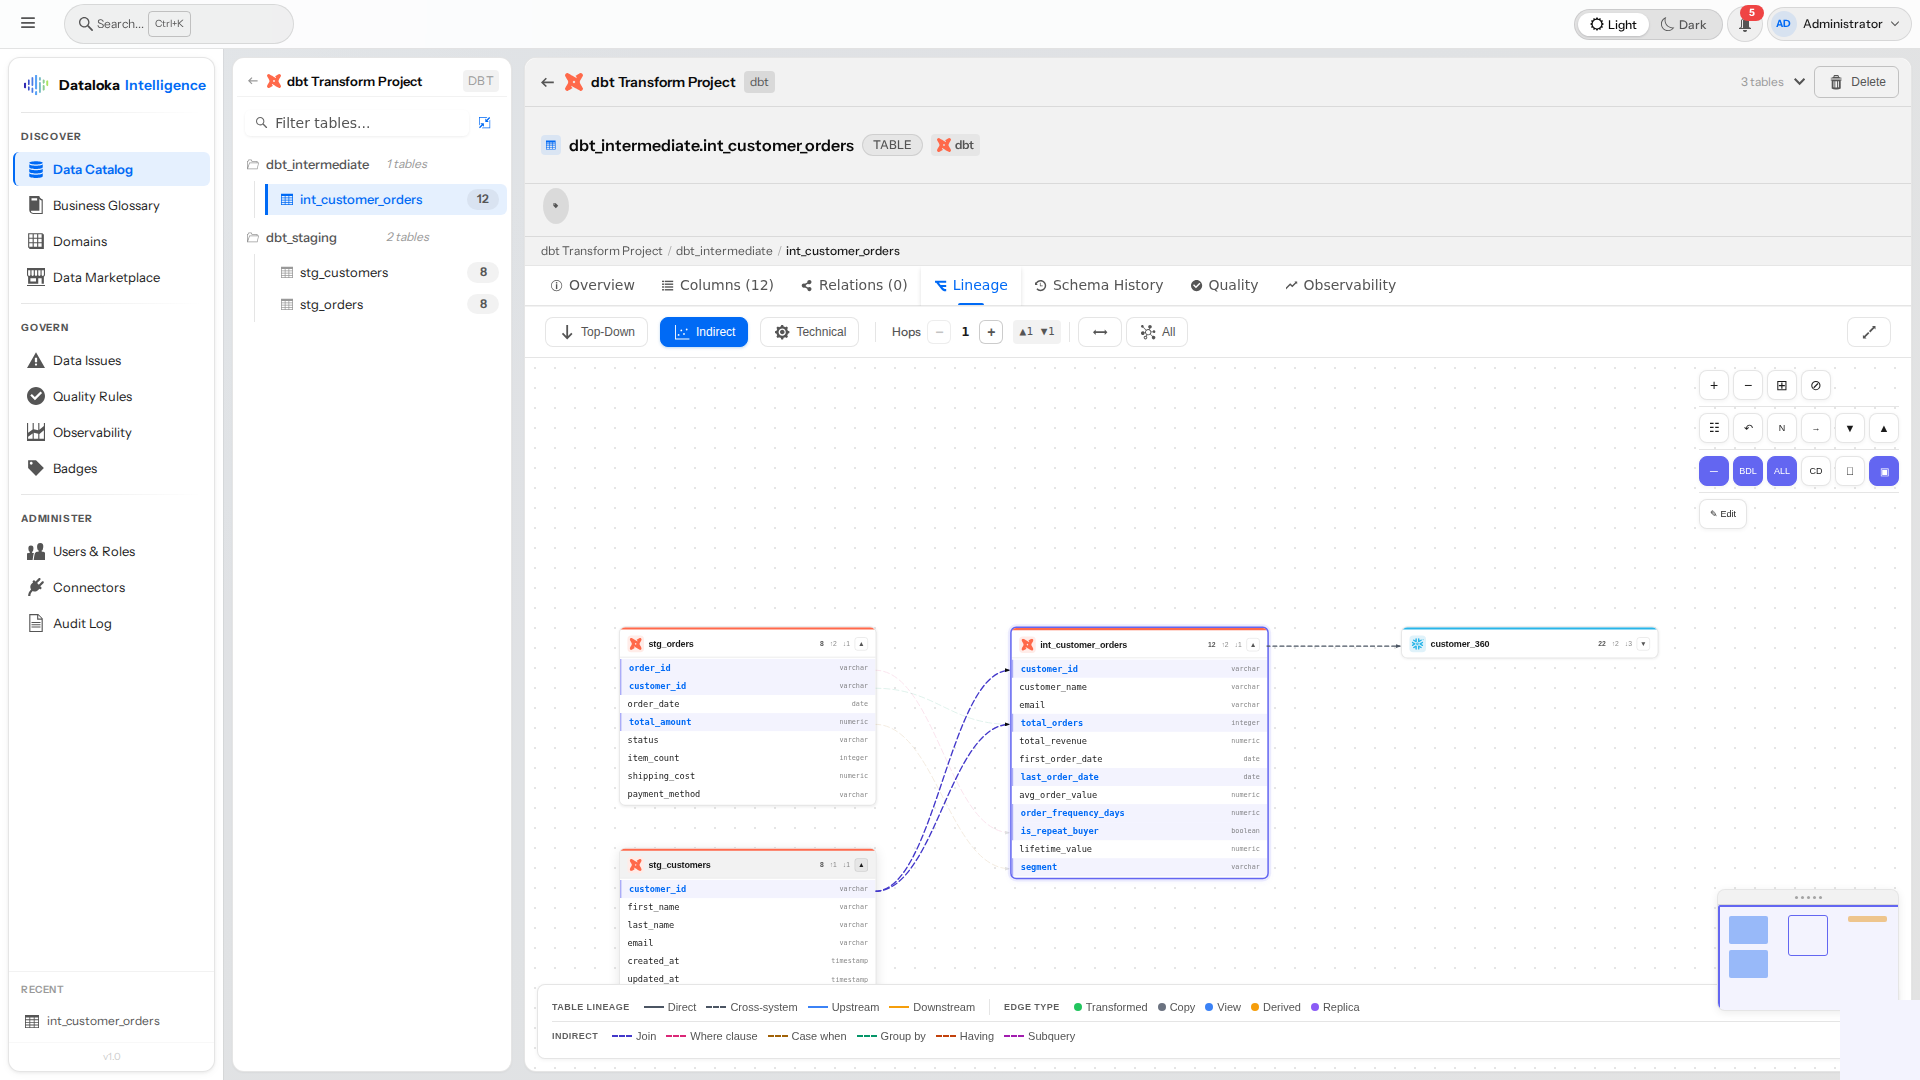
Trace Every Data Journey

Answer “where did this number come from?” in seconds. Visualize the complete flow of data from source systems through transformations to BI dashboards — across every platform in your stack. From table-level overview to column-level precision.

Cross-platform table lineage — dbt, databases, BI tools
🔗
Cross-Platform Lineage
End-to-end data flow spanning databases, data pipelines, and analytic tools — all in one interactive graph.
📄
7+ SQL Dialect Parsing
Automatic lineage extraction from T-SQL, PL/pgSQL, PL/SQL, Snowflake, BigQuery, Spark SQL, and MySQL — no manual mapping required.
⚠️
Impact Analysis
Instantly see every downstream report, dashboard, and pipeline affected by a schema change — before you make it.
🎨
Column-Level Lineage
Color-coded edges showing Identity, Transform, Aggregate, Cast, and Case When operations. See indirect dependencies from JOINs, WHERE, and GROUP BY clauses.
⚙️
ETL Tool Integration
Automatic lineage from Azure Data Factory, SSIS, dbt, Fivetran, and OpenLineage. Manual drag-and-drop editor for custom transformations.
Column-Level Lineage
Every Column, Every Transform
IdentityTransformAggregateCastCase When
Column-level lineage — color-coded transform operations with direct and indirect edges
Go beyond table-level lineage. Expand any table card to see exactly how each column is derived — with color-coded edges for direct transform operations and dashed lines for indirect dependencies (JOINs, WHERE, GROUP BY). Confidence scores and syntax-highlighted SQL give your team full transparency into every calculation.
Data Classification & Critical Data Elements

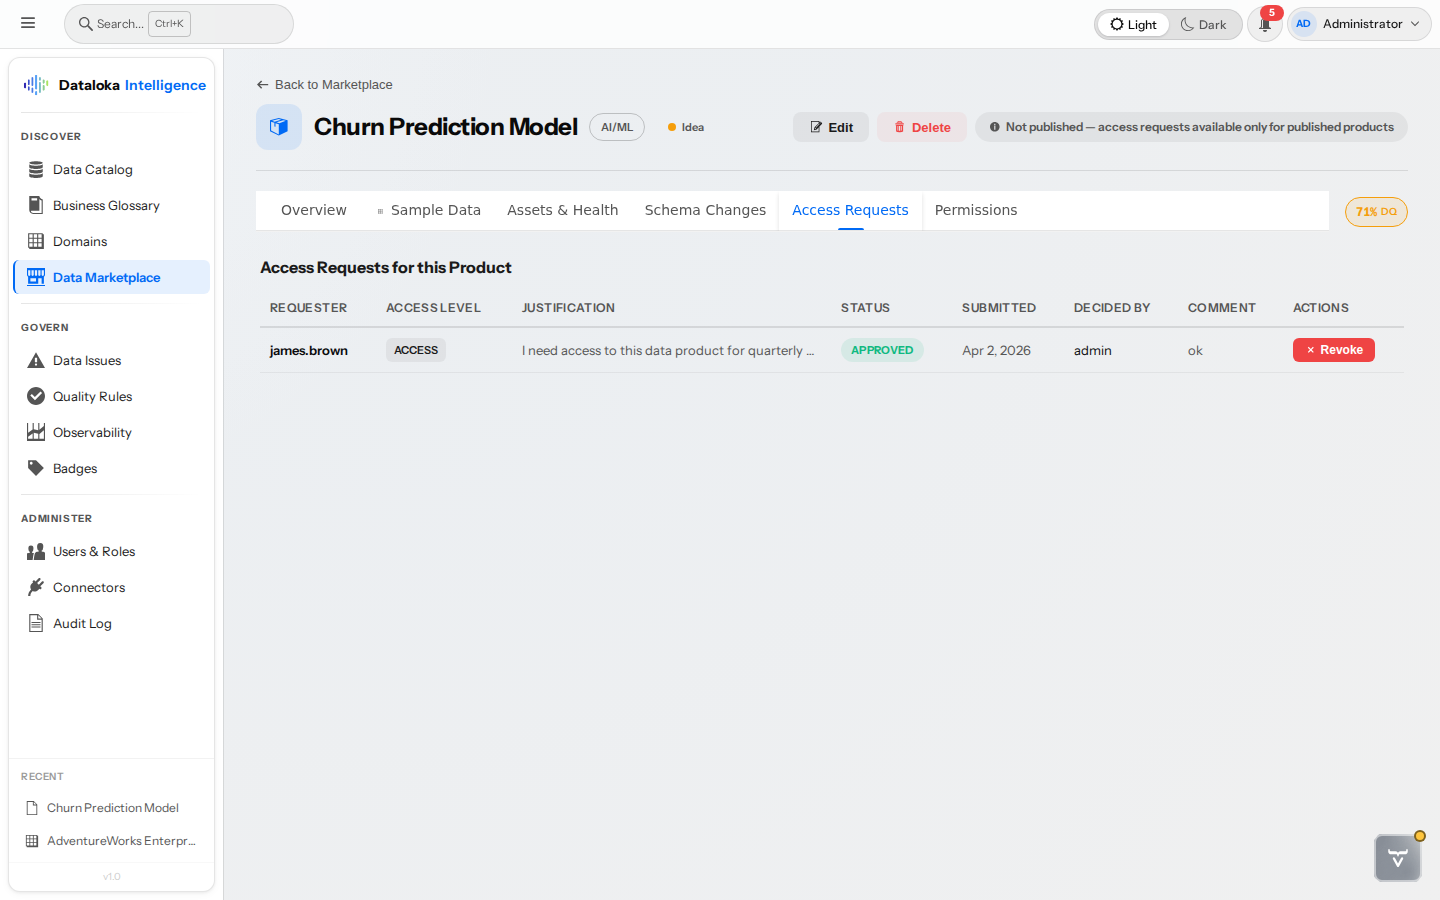
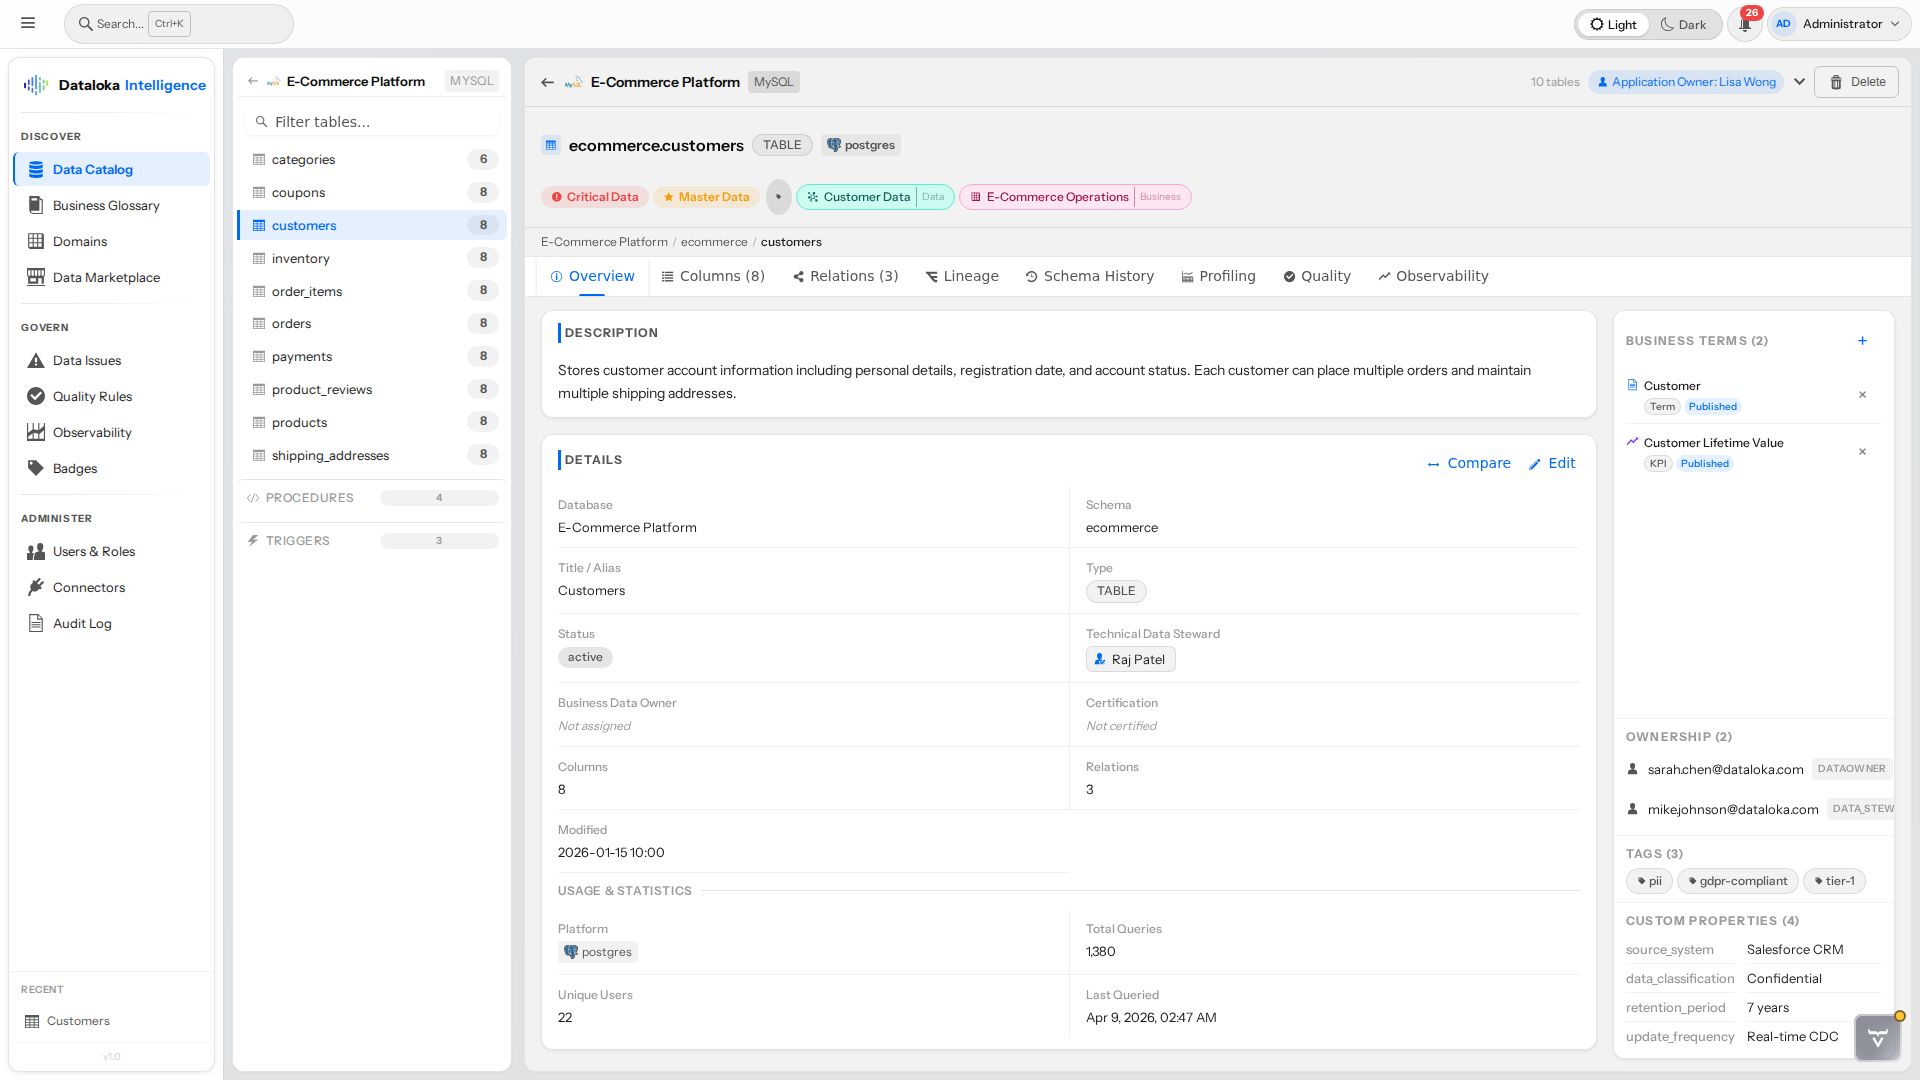
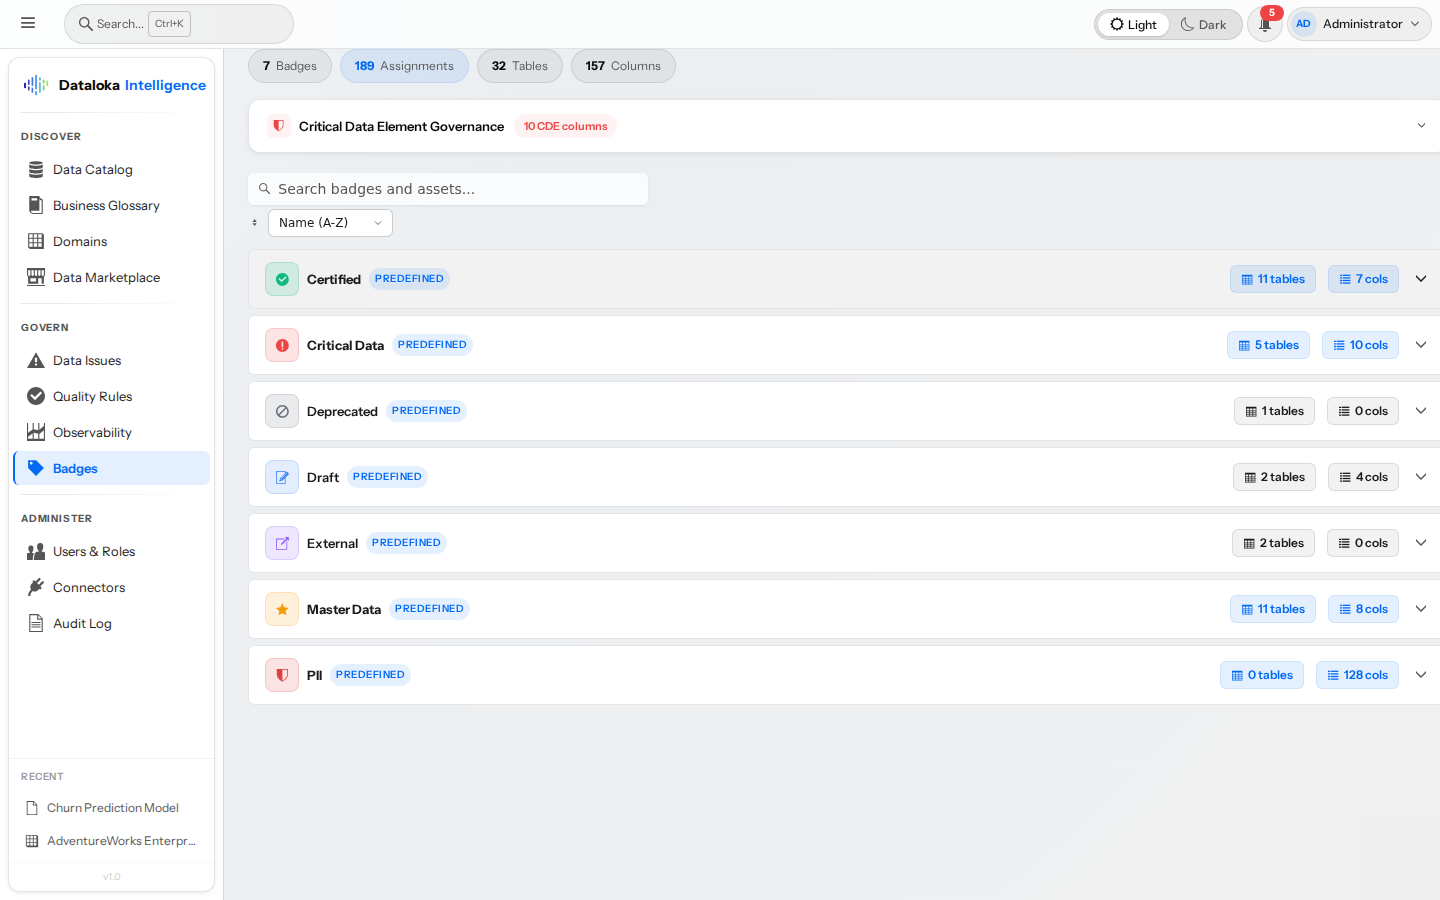
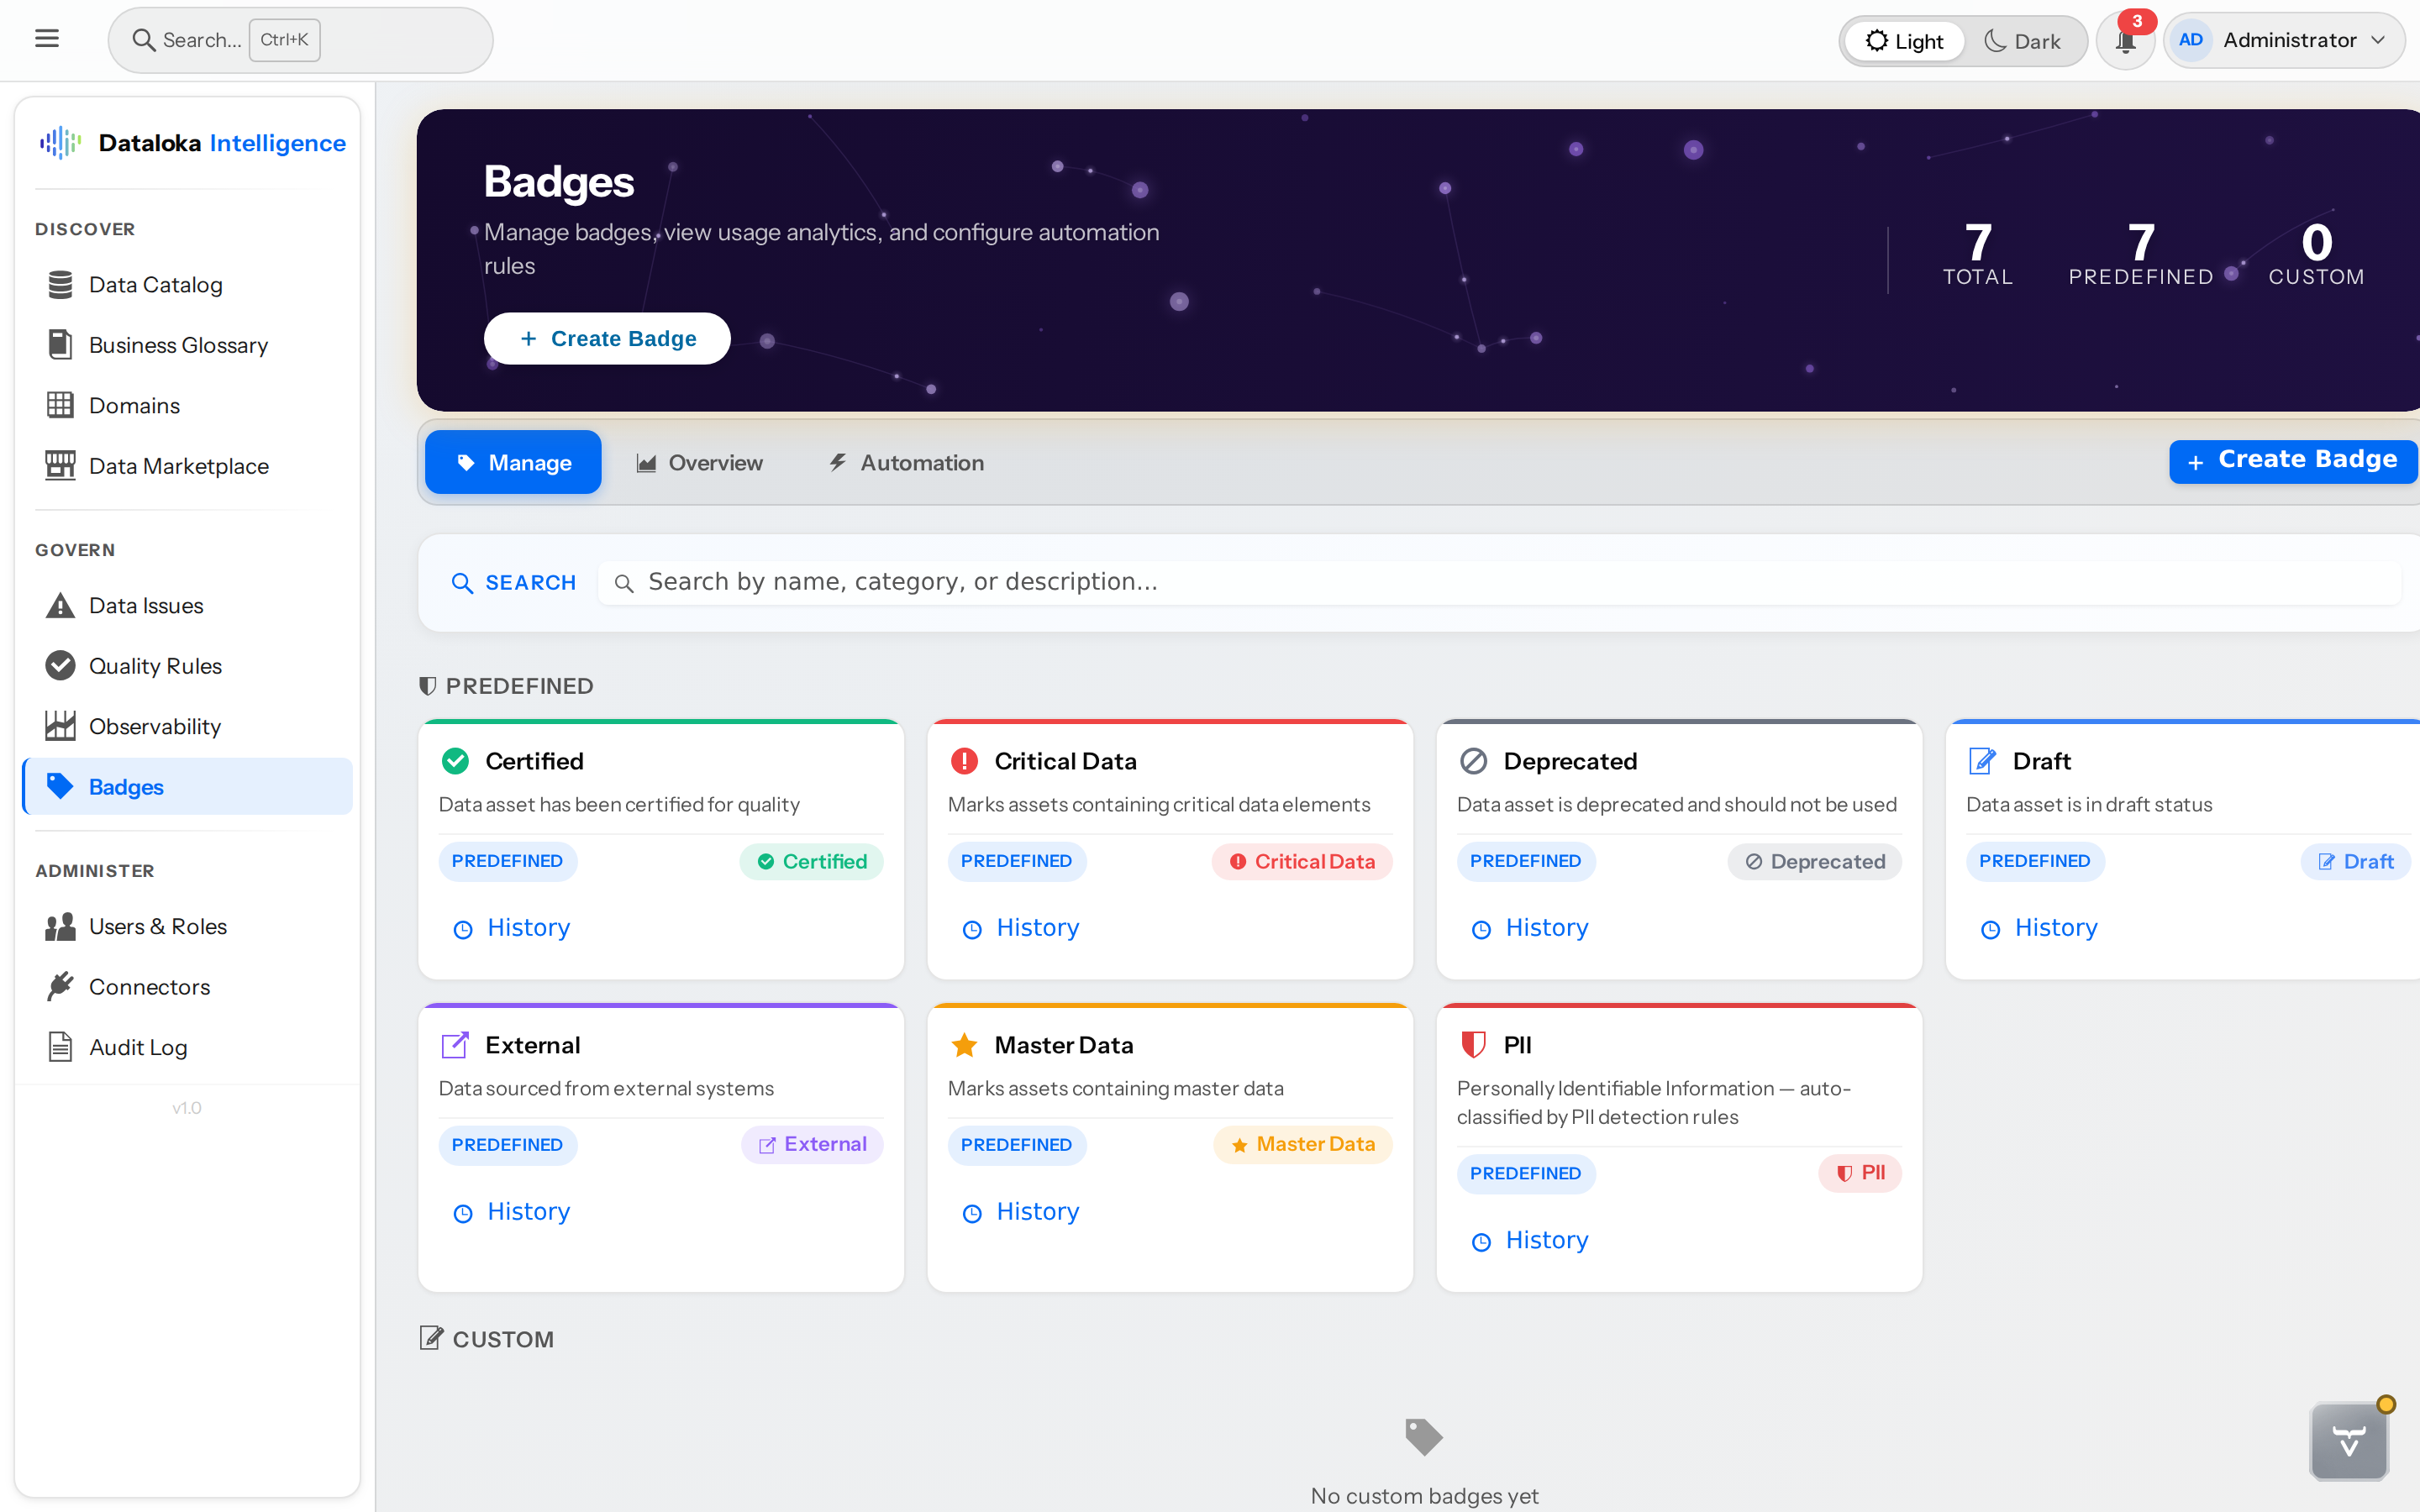
Know Which Data Matters Most

Classify assets as Critical Data Element, Master Data, Certified Data Quality, or PDP/PII Sensitive Data — then let the platform enforce higher quality standards, tighter access controls, and regulatory compliance automatically. Your most important data gets the governance it deserves.
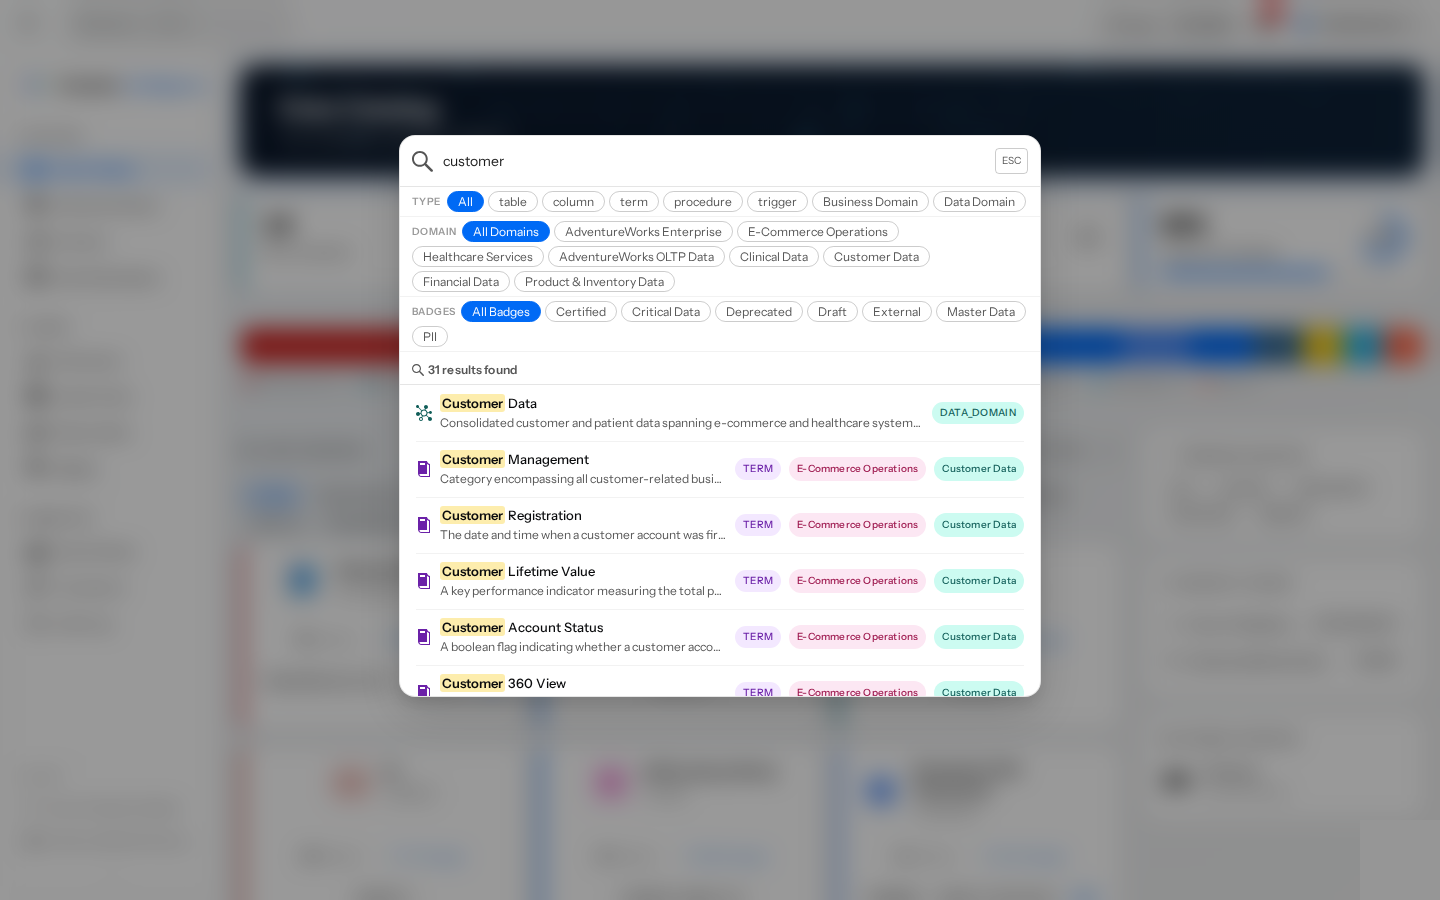
Data Classification badges and CDE governance dashboard
🏆
6 Predefined + Custom Badges
Critical Data, Master Data, Certified, Deprecated, External, and Draft out of the box — plus unlimited custom badges for your organization’s needs.
📊
CDE Governance Dashboard
Track documentation coverage, quality rule coverage, steward assignment, and term mapping at a glance — across all your critical data elements.
🔄
Auto-Propagation
Classify a glossary term and every linked column inherits the badge automatically. Bulk classification with multi-select for rapid onboarding.
📜
Full Audit Trail
Who classified what, when, and why — complete traceability for compliance audits and regulatory reporting.
🏛️
Regulatory Framework Support
Built-in support for PII, HIPAA, GDPR, PCI-DSS, SOX, BCBS 239, and Indonesia PDP Law classifications.
Badge Management
Badge Management — predefined and custom badges with automation rules
Manage all classification badges from one place — Certified, Critical Data, Master Data, PII, Deprecated, External, and Draft. Create custom badges and configure automation rules for your organization.
CDE Governance
CDE governance dashboard — coverage metrics across documentation, quality, steward, and term mapping
Track Critical Data Element governance health across the enterprise — documentation coverage, quality rule coverage, steward assignment, and term mapping metrics in one dashboard.
Connector Framework

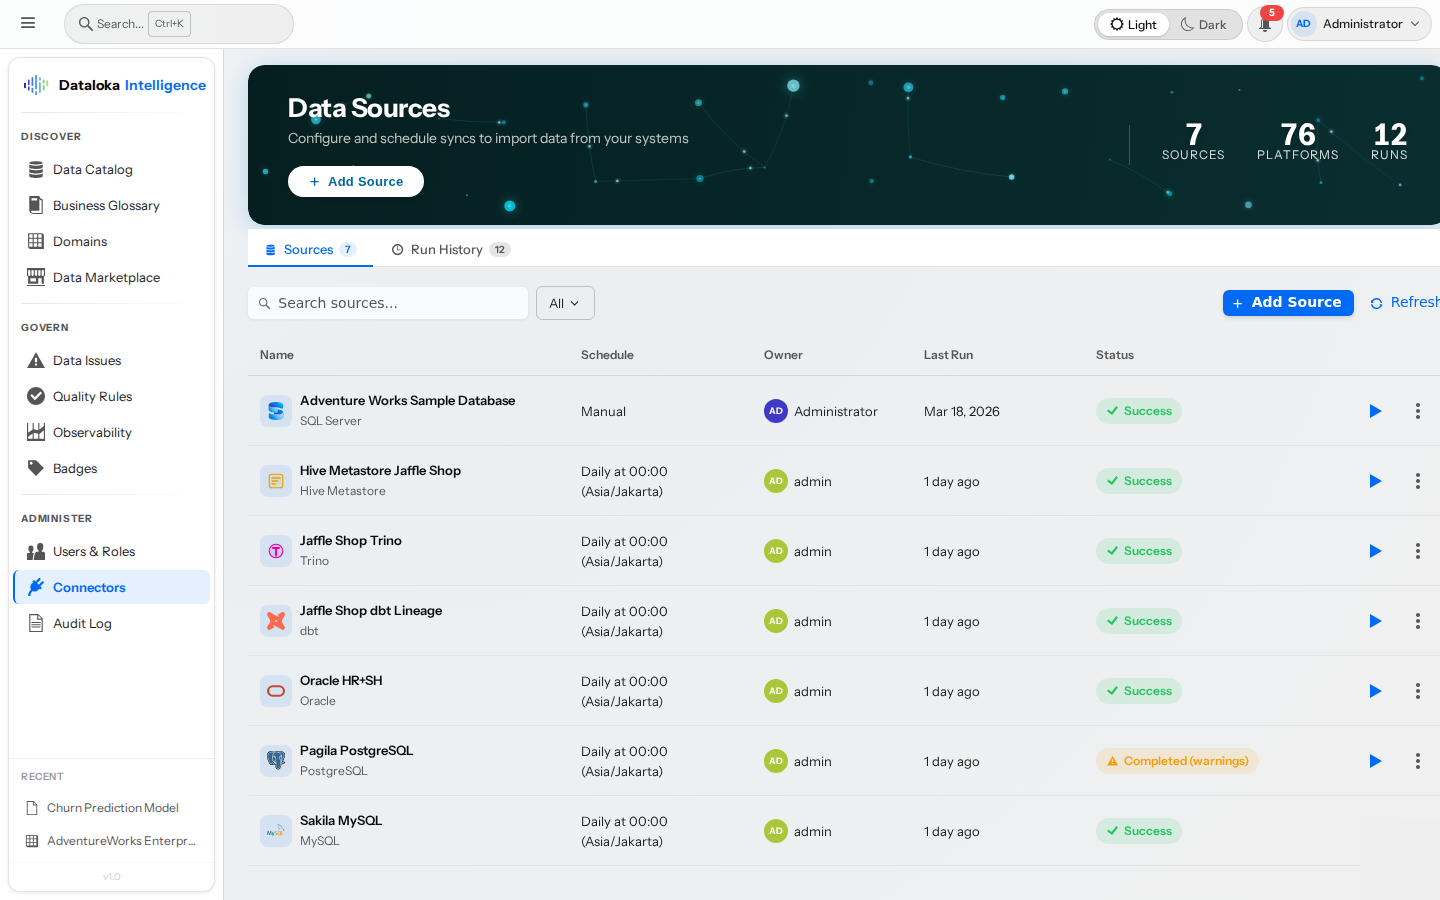
70+ Connectors. One Platform.

Connect your entire data stack in minutes. Automated metadata ingestion from databases, warehouses, data lakes, BI tools, ETL pipelines, and ML platforms — with incremental sync and encrypted credential storage.

Databases
PostgreSQLMySQLSQL ServerOracleMariaDBClickHouseMongoDBCassandraDynamoDBSAP HANACockroachDBElasticsearchSalesforceAzure SQLAmazon AuroraDruid
Data Warehouses & Lakes
SnowflakeBigQueryAmazon RedshiftDatabricksVerticaTeradataApache HiveAmazon S3Azure Blob StorageGoogle Cloud StorageAWS GlueApache IcebergDelta LakeHive MetastoreCSV / Excel / JSONGoogle Dataplex
BI & Analytics
Power BITableauLookerLookMLMetabaseSupersetGrafanaQlik SenseRedashModeSigmaHexPresetSSRSSSASFeast
ETL, Orchestration & ML
dbtApache SparkApache AirflowFivetranAzure Data FactorySSISDagsterPrefectApache NiFiApache KafkaKafka ConnectApache PulsarCoalesceHevo DataMLflowAmazon SageMakerOpenLineageTrinoPrestoAthena
Dataloka Intelligence Connector Management — 70+ data source integrations
Enterprise Security

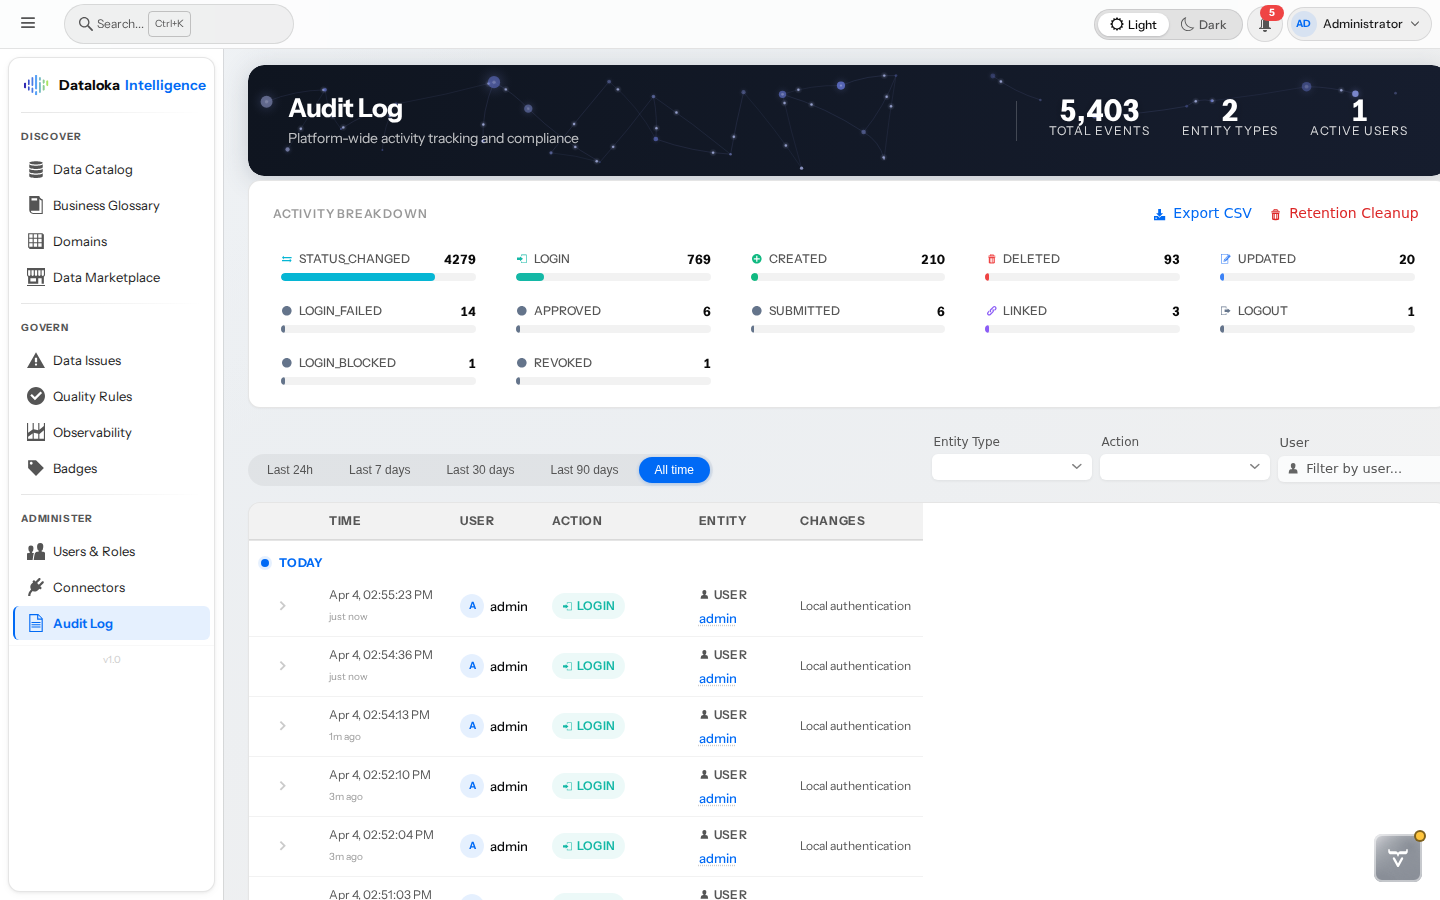
Enterprise-Grade Security & Governance

Meet the strictest compliance requirements with 11 governance-aligned RBAC roles, ISO 27001:2022 security controls, enterprise SSO, and a complete audit trail for every action.

🔐

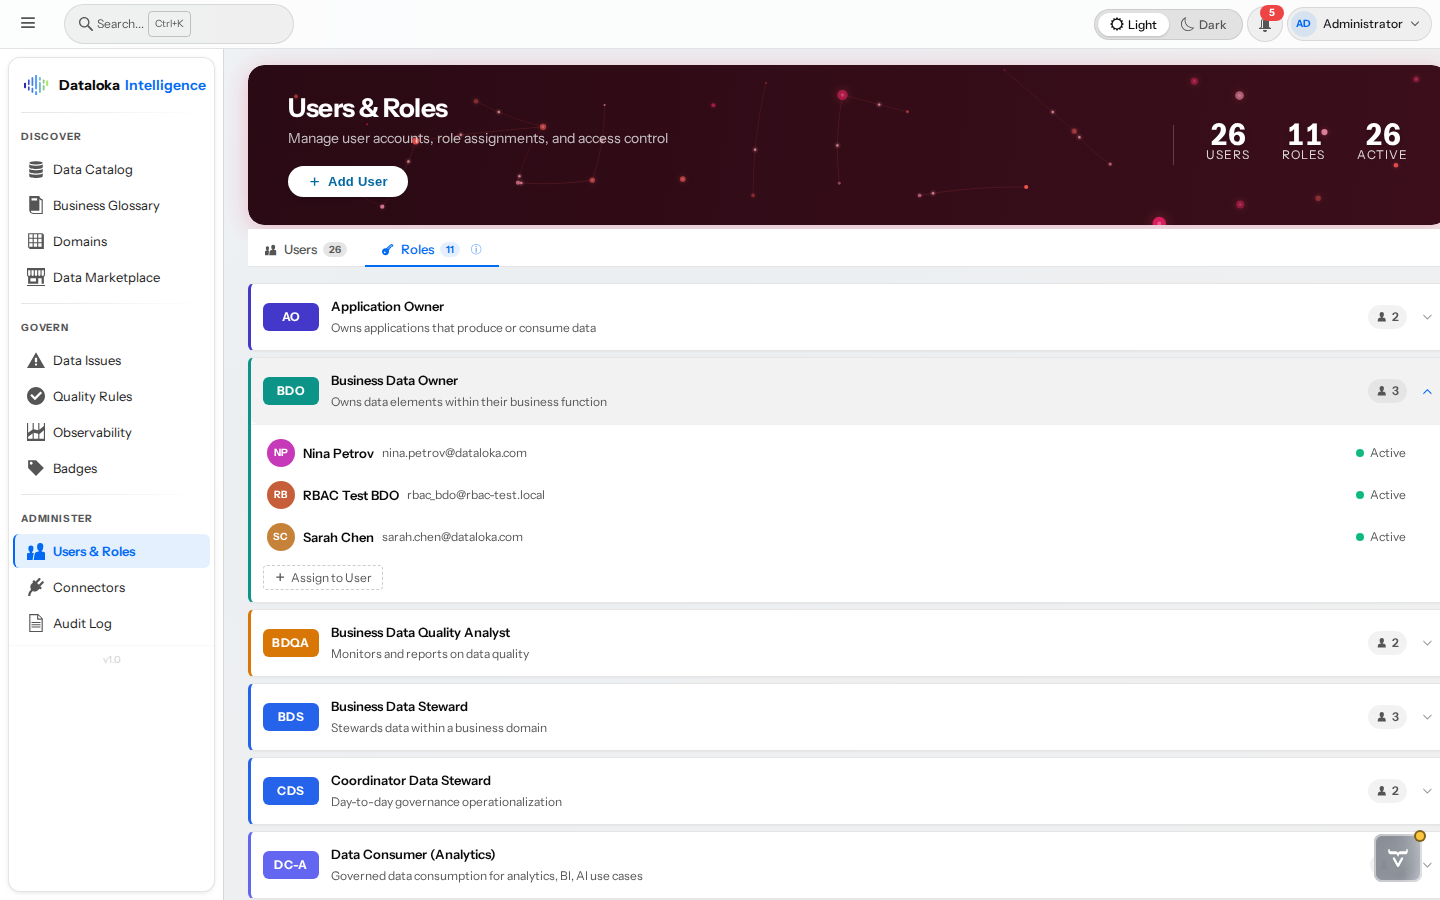
11 RBAC Data Stewardship Roles

Assign the right level of access to the right people. 11 governance-aligned roles with 37 fine-grained permissions across every module — from Enterprise Data Steward to Data Consumer.

Enterprise Data StewardBusiness Data OwnerTechnical Data StewardApplication OwnerData Consumer — Analyst
🛡️

Cyber Security Hardened

Built to enterprise security standards — ISO 27001:2022 Annex A controls and OWASP Top 10 protections included out of the box.

Account lockout & rate limiting
BCrypt hashing & JWT tamper-proof tokens
Injection-safe queries & XSS sanitization
CORS whitelisting & path traversal blocking
Security headers (CSP, X-Frame, SameSite)
Full security audit trail
🌐

Enterprise SSO

Integrate with your existing identity provider. SAML2 SSO (Azure AD, Okta, Keycloak) and LDAP/Active Directory with auto-provisioning and group-to-role mapping — zero friction for your IT team.

Users & Roles Management dashboard with RBAC role configuration
Audit log showing user activity tracking and compliance trail
Theme & Design

Beautiful in Light.
Stunning in Dark.

A platform your team actually enjoys using. Full light and dark mode, responsive design from desktop to tablet, and a polished UI that makes data governance feel effortless.

Light Mode
Dataloka Intelligence Light Mode — Data Catalog Dashboard
Dark Mode
Dataloka Intelligence Dark Mode — Data Catalog Dashboard
Pricing

Subscription Plan Tiers

Annual subscription · SaaS managed · Pricing in IDR Juta & Miliar · Indonesia market

Pilot
100Juta
IDR/tahun (~8,3 Juta/bln)
5 Users Total
  • 5 data sources
  • Data Catalog
  • Business Glossary
  • Global Search
  • Data Issue Management
  • Data Stewardship RBAC
  • 5-day PoC support
  • 3 month remote online support
  • 6-month minimum term
Ideal For
Proof of Concept
Starter
200Juta
IDR/tahun (~16,7 Juta/bln)
15 Data Stewardship Users
Everything in Pilot, plus:
  • 20 data sources
  • Data Lineage + ER Diagrams
  • Basic Data Profiling
  • Data Domain Management
  • Unlimited view-only Data Consumer users
  • Full-year remote online support
  • Cloud deployment
Ideal For
Small–mid project
Populer
Standard
500Juta
IDR/tahun (~41,7 Juta/bln)
50 Data Stewardship Users
Everything in Starter, plus:
  • 50 data sources
  • Data Quality Rules & Monitoring
  • Data Observability Rules & Monitoring
  • Data Classification badges
  • Data Marketplace
  • Data Product Access Lifecycle
  • 2 TB Built-in Data Lakehouse
  • 6 day/year offline supports
  • Cloud Deployment
  • 5 days consulting included
Ideal For
Enterprise mid-market
Soon
Enterprise
1Miliar
IDR/tahun (~83,3 Juta/bln)
200 Data Stewardship Users
Everything in Standard, plus:
  • Unlimited data sources
  • AI Data Discovery & Analytic Agent
  • AI Metadata Autodoc Agent
  • AI Lineage Mapping Agent
  • AI Semantic Mapping Agent
  • Unlimited Built-in Data Lakehouse
  • On-prem deployment + AI LLM starter server
  • SSO support
  • 2 day/month offline supports
  • 10 days consulting included
Ideal For
Enterprise / BUMN
📄
Terms & Conditions
Add-ons & Payment
Extra Data Sources
Pilot, Starter & Standard
IDR 5 Juta/source/yr
Extra Data Stewardship Users
All tiers
IDR 5 Juta/user/yr
Extra Data Lakehouse Managed Service
Standard only — billed monthly
IDR 10 Juta/TB/month
Training On-site
All tiers — 2 days per session
Free 1st session, next IDR 50 Juta/session
Monthly Payment
Pilot, Starter & Standard
+20% of annual
Discounts & Compliance
📅
Multi-Year Discounts — 2 years: -10% | 3 years: -15%
Commitment = savings
🏛️
Government / BUMN — TKDN-certified, LKPP e-catalog
Priority procurement
🖥️
Enterprise tier - Starter server specs
NVIDIA Grace Blackwell — 20-core Arm CPU, 128 GB unified memory, Wi-Fi 7, 10 GbE, 4 TB NVMe SSD, supports AI LLM models up to 200B parameters
All prices are exclusive of applicable taxes (PPN/VAT).

Ready to Govern
Your Data?

Join data-driven organizations across Indonesia and Southeast Asia using Dataloka Intelligence to catalog, govern, and deliver trusted data — reducing risk, accelerating insights, and building a culture of data confidence.